Poll expert Sam Wang, from the Princeton Election Consortium, ate a cricket live on CNN after losing a bet. Based on his statistical analysis of presidential polls, he didn’t believe Donald J. Trump would win more than 240 Electoral College votes.

Data is a tricky thing. If you misread the data or overlook important points, you could end up in Wang’s place, erroneously making bets you think you can’t lose.
While business intelligence isn’t the same as political data, the overall concepts involved are the same. You look at facts, data and relevant parameters. You build out predictions, strategies and investments based on that analysis. And sometimes, when you bet on these analyses, you bet it all. Unfortunately, though, you may have a lot to lose.
In Business Acumen vs. Business Intelligence, author Robert Brodo says, “Business Intelligence (BI) is the ability to prioritize what is important and not waste time on the things that aren’t important.” And that’s the crux of the issue. Business intelligence only works if it’s actually intelligence, and not leading us down the wrong path.
That’s the whole point of BI, right? To help us avoid the risks involved with simply following our guts? While I’m not advocating we all become statisticians, I am saying we need to learn more about data and how we can use it to help our businesses.
Visuals Aren’t Enough
In this social media-obsessed age, it’s easy to look at something like your number of Twitter followers and think, “We are awesome!”
But are you really?
Data visualizations are great for rendering complex information easily digestible, but not every visualization displays the data points you need most.
What’s the engagement, ROI, or clicks to an action or website? What’s demographic traits do your most engaged fans share? To what extent is your social media activity actually impacting your bottom line? Which geo areas are driving your highest conversion rates? Which social channels are referring the customers whose orders are the biggest, or who give you the most repeat business over time?
For these types of insights, you’ll need to collate data from multiple sources, which is far easier to accomplish today than it was just a couple of years ago, thanks to the rise of “self-service” business intelligence (SSBI) tools like Sisense, Birst and Qlik.
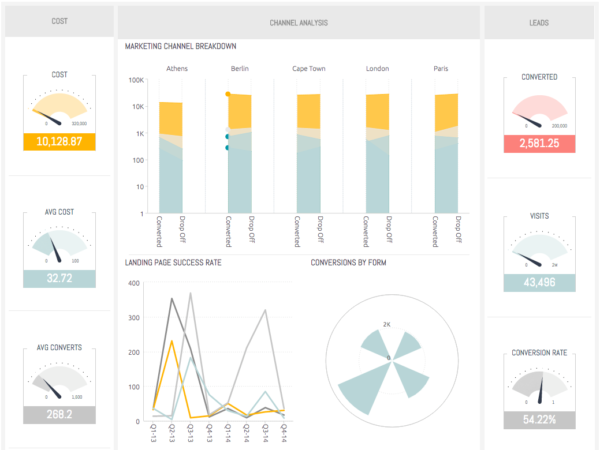
SSBI platforms are generally controlled by using simple, drag-and-drop interfaces that don’t require any database or coding skills, so they’re especially useful for small business managers. Check out the below dashboard as an example.
“While we like to see our data in easy to handle visualizations, platforms that only give you this are not enough to get real insights from your company’s data,” Sisense’s Aya Ephrati recently wrote in a provocative thought piece about the pitfalls associated with visualizations that don’t display any real meat. “With data visualization tools, as you can imagine from their name, you don’t have all the initial, background stages of preparing and joining the data.”
Just because SSBI makes data more accessible doesn’t mean that the data you work with needs to be over-simplified. In Data Dojo: 3 Reasons Marketers Need to Learn Statistical Analysis, I argued that “We are entering an era of smart data where everyone in an organization will be able to harness the power of business intelligence. So while I don’t believe we have to go back to school and become actual statisticians, I do believe we need to become proficient in numbers.”
Don’t rely on visuals from someone else’s analysis. Learning about the information that’s going into a cool chart is more important than the graphics themselves.
Sounds Too Good to Be True? It Probably Is.
How many times have you relied on an expert’s advice?
Many years ago, when I first started my business, I was determined never to learn about taxes. I wanted to pay someone else to do everything that involved my finances (yeah, forgive me – I was young and hated math). My IRS expert always got us lots of money back. Why would I ever question free money?
That worked for a few years until my “expert” tax guy wound up in jail for defrauding the IRS and we lost tens of thousands.
While it’s not exactly the same, the lesson applies to data experts too. I didn’t want to deal with a business issue and let someone else make business decisions for me. In The Signal and the Noise: Why So Many Predictions Fail – but Some Don’t, author Nate Silver writes, “People gravitate toward information that implies a happier outlook for them.” That’s exactly what happened to me.
While I’m not suggesting that we stop using data experts, I am shouting loudly that we need to question everything. Get second and third opinions. Ask where the data came from and how it was analyzed. Especially when it sounds too good to be true.
Trends Can Point to Predictions – Not Prophesies
There’s a huge difference between BI and predicting the next trend.
Business intelligence can give us a snapshot of what happened last year. Predictive analytics looks at what may happen next year.
Let’s say you have an eCommerce business that uses abandoned shopping cart technology. It can tell you that 100 people left an item in their shopping cart without buying it. It can’t tell you why they didn’t buy it, but it can send a follow-up reminder email (maybe with a free shipping offer) to entice the customer back.
In Dell’s Business Analytics: Moving From Descriptive To Predictive Analytics, author Bill Schmarzo explains the difference.
Business Intelligence answers:
- When did customer X abandon the shopping cart?
- How many customers purchased an item after receiving a follow-up email offer?
Predictive Analytics answers:
- What’s the probability that customer X buys something this week?
- How much revenue will be generated by abandoned shopping cart technology?
Use the right data for the right problem. BI gives you facts and reliable data. Predictions may give you possible trends for the next year.
Never Make a Bet You Can’t Afford to Lose
Data is changing the way we do business. We can pinpoint certain timeframes and learn everything we can about a marketing campaign. And BI isn’t limited to tech wizards from the IT department anymore. The entire marketing department can use the same data and make decisions based off the success or failure of the last campaign.
Yet, the entire concept of BI is to improve our businesses. It’s to figure out how we can connect with customers faster, easier and cheaper. It’s to help us make more money.
Our ability to use data to our advantage is an essential part of being a successful business in the digital age. We have all this information at our fingertips. And so did poor Sam Wang, who had to eat a bug because he lost a bet.
Remember the brave Sam Wang the next time you’re about to make a data bet you can’t afford to lose.