
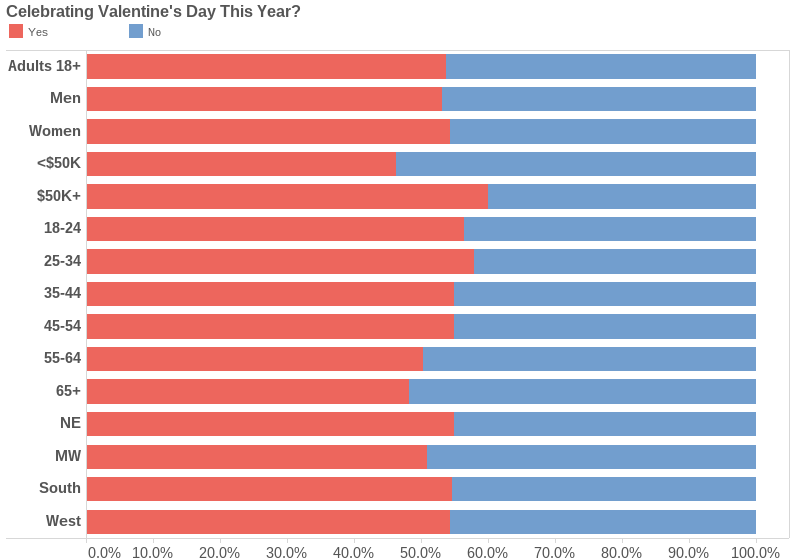
This year, consumers weren’t quite ready to splurge on Valentine’s Day. According to the National Retail Federation’s 2014 Valentine’s Day spending survey conducted by Prosper Insights and Analytics, 53.8% of Americans–down about six points at 59.9% last year–celebrated the special day. However, the average consumer spent $133.91, compared to $130.97 last year. This continues an upward trend beginning in 2009, when spending dropped by about $20 from 2008.
Men spent more than twice as much as women for their significant others–$108.38 versus $49.41. Many consumers still created budgets for family members, friends, teachers, co-workers, and pets! This Valentine’s Day season is expecting to see a total spending of $17.3 billion, down 6.99% from 2013.
So, who celebrated Valentine’s Day this year? The demographics consist of adults who are at least 18 years old, broken down by gender, income, age group and region of the U.S.
 (Click here for the interactive version)
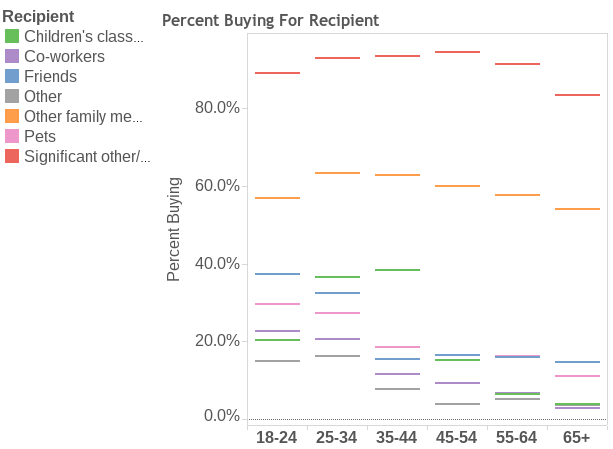
Of course, many consumers purchased gifts for significant others. We can see others that consumers thought of below.
(Click here to go to the interactive version)
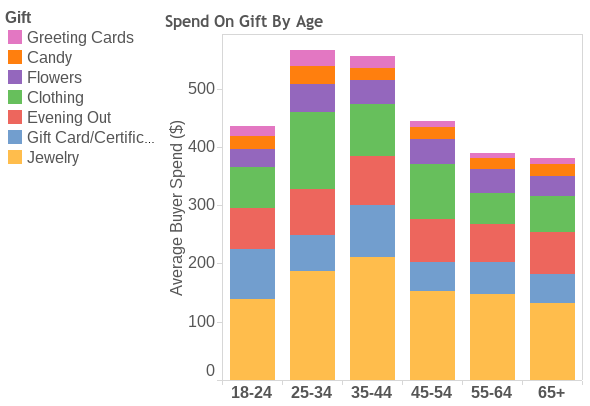
This next chart gives us an idea of how much each age group spent on various gifts.
(Click here to go to the interactive version)
Here are some other interesting notes from the data:
- The 65 and older demographic felt less of a need to celebrate Valentine’s Day than any other age group.
- The 25-34 year-old demographic spent the most on co-workers with an average spend of $83.80.
- At an average spend of $210.30, jewelry was the most expensive gift purchased overall by the 35-44 year-old age group.
You can view more at Growth Learner. You’ll be able to see a few more charts and hover over the data points and elements of each chart for details.
Does this data match your experience?