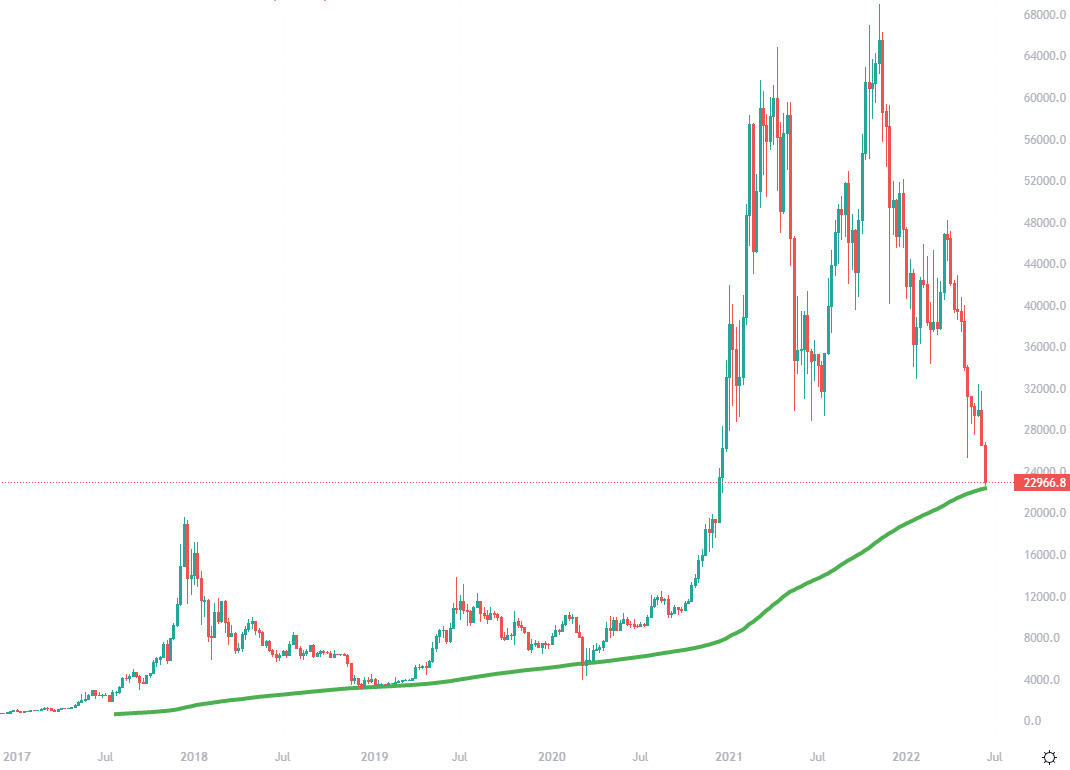
Bitcoin tested the 200 week moving average – at about $22,500 – then bounced over 2% today. The 200MA has been a support level for 7 years.
Buyers in fact front-ran the 200 week MA slightly – it varies by crypto exchange but on the Binance BTC/USDT chart for example that moving average line is at $22,360 and Bitcoin put in a bounce from a daily low of $22,600.
The June 13th daily candle will close in one hour, and Bitcoin will likely close it above that weekly moving average – now trading at just under $23,000.
Cryptoassets are a highly volatile unregulated investment product. Your capital is at risk.
Importance of the Bitcoin 200 MA
On the Bitcoin price chart, no weekly candles have closed under the 200 MA – including the drop to the $3.1k bottom in the 2018 bear market, and the covid crash of March 2020. There have only been brief wicks below that support level, quickly bought up by buyers.
Zooming out on the BTC price chart further – which can be done on the Bitstamp chart or the BraveNewCoin Liquid Index chart on Tradingview – the Bitcoin 200 MA also acted as support in January 2015.
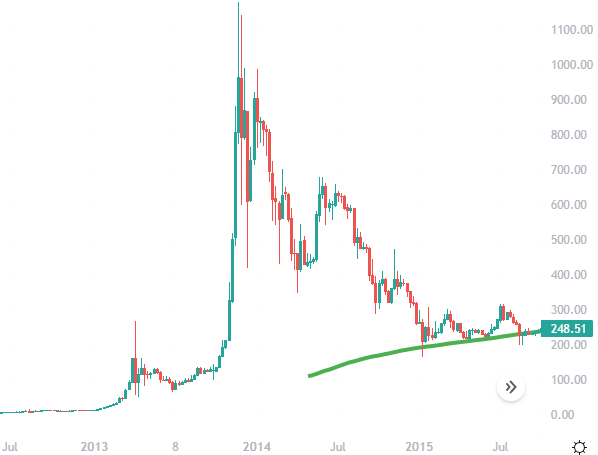
Bitcoin 200MA support in the 2015 – 2016 bear market
So for 7.5 years, the Bitcoin 200 MA has acted as an important historical support line, holding up the Bitcoin price. Will it now be broken amid recession fears? That remains to be seen, but being bearish at support is usually a mistake for investors and traders.
Over Bitcoin’s price history any touches of that moving average have been the best time to buy Bitcoin, at least by dollar cost averaging (DCA) into a position.
Bitcoin 200 SMA vs 200 EMA
Moving average (MA) indicators are also referred to as simple moving averages, different to exponential moving averages in how they are calculated.
The 200 SMA is seen as more accurate for technical analysis on high timeframe (HTF) price charts, and the 200 EMA is often preferred on a low timeframe Bitcoin chart, more sensitive to short term price movements.
An SMA calculates the average of price data, and an EMA give more weighting to more recent price data, by applying a multiplier so that older price action (PA) has less of an impact.
In the case of the Bitcoin 200 week SMA, it is an arithmetic mean – adding the last 200 weekly closing Bitcoin prices together and dividing the total by 200 to calculate the average.
Update – Bitcoin hit $17,600 on June 18th during weekend price action, with lower liquidity and fear over an ETH whale being close to liquidation. BTC closed green the following week at just over $21,000, but still below the 200 week MA.
Related
- Bitcoin Long Term Price Forecast
- Tim Draper’s $25k Bitcoin Price Prediction
- How to Buy Bitcoin ETFs
- Best Crypto To Buy Now
- Best Crypto Presales to Invest in 2025 – Compare Pre-ICO Projects
- New Cryptocurrencies to Invest in 2025 – Compare New Crypto to Buy
Crypto Signals - Learn to Trade

- Free Telegram Community & VIP Channel
- 3 - 5 Crypto Signals Daily
- VIP Access when Opening an Exchange Account
- Market News & Technical Analysis - cryptosignals.org