
Bitcoin (BTC) trades below $20,000 for the first time in over a week as weakness in Asian stocks raised the prospects of further downside. Bitcoin traded as low as $19,850 on Wednesday recovering slightly to the current price around $20,112.
This reflected a market still linked to movements in global stocks. The S&P 500 finished the June 28 session down 2%, while the Nasdaq Composite Index fell 3%. Likewise, Hong Kong’s Hang Seng was down 2.1% for the day, and China’s Shanghai Composite Index traded 1.4% lower during the same time.
With no bullish signals coming from the macro economic environment, the flagship cryptocurrency has little stopping it from revisiting the lower end of a descending parallel channel over the next few weeks.
“Most short-term technical indicators suggest a higher-than-normal likelihood of a final ‘washout’-style drop before we hit the bottom,” said Mark Newton, a technical strategist at Fundstrat, in a note on Tuesday. If the support level at $19,500 fails, Bitcoin might slide down toward the $12,500 support line, “which I believe would be a great spot for intermediate-term buyers to increase their long positions,” he added.
Cryptoassets are a highly volatile unregulated investment product. Your capital is at risk.
Newton’s sentiments were corroborated by technical indicators on the weekly price chart which showed Bitcoin price trading within the confines of a descending parallel channel projecting a slump to $12,000. This could give sidelined investors an opportunity to buy Bitcoin at lower levels.
Bitcoin Price Downtrend Remains Intact
After producing the lowest weekly close since December 2020 on June 13, the technical setup on the weekly chart (below), hinted at further losses for Bitcoin price. The appearance of a descending parallel channel added credence to this bearish outlook. If the bears continue to aggressively defend the immediate resistance at $22,403, embraced by the middle boundary of the descending channel, the big crypto may drop towards $15,000.
Traders could expect buyers to aggressively defend this level with the likelihood of staging a comeback. However, increasing overhead pressure could push the pioneer cryptocurrency towards the technical target of the prevailing chart pattern around $12,522.
BTC/USD Daily Chart
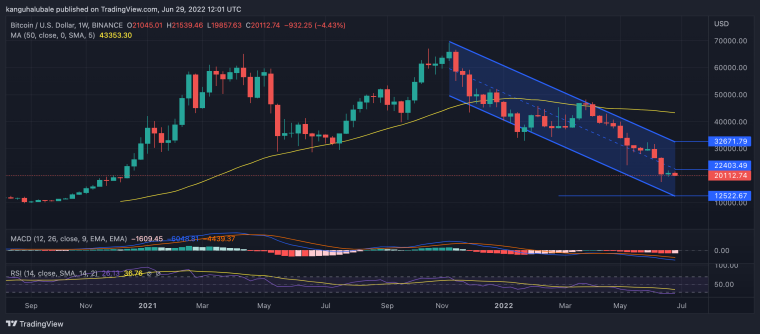
The weekly Moving Average Convergence Divergence (MACD) indicator is moving downwards in the negative region with the 12-weekly EMA below the 26-weekly EMA, emphasizing the negative market sentiment. In addition, the Relative Strength Index (RSI) was positioned in the oversold region. The price strength at 26 affirmed the bears’ grip on BTC, suggesting that there was still more room for further losses. This was further supported by the position of the moving averages and the Parabolic SAR above the price.
On the upside, bulls could try to defend and hold the price above the $19,500 support level. If they succeed, Bitcoin price may turn up from the current levels to tag the middle boundary of the channel at $22,400, before reaching the $25,000 psychological level. Market participants could expect the local top for the pioneer crypto to be formed here.
Related Bitcoin And Analysis News:
Bitcoin Miners in China See Bleak Futures Ahead as Outlook Darkens
- How To Invest In Bitcoin
- How To Invest In Bitcoin
Lucky Block - Undervalued Crypto![]()
![]()