 The study was released by Nanigans, who happens to be one of the largest buyers of Facebook ads, and whose conclusions are based on data from 200 billion Facebook ads. Speaking to John Koetsier from VentureBeat, Nanigan’s SVP Dan Slagen remarked, “…the company was a little on the fence about publishing that data, knowing that it would be controversial.”
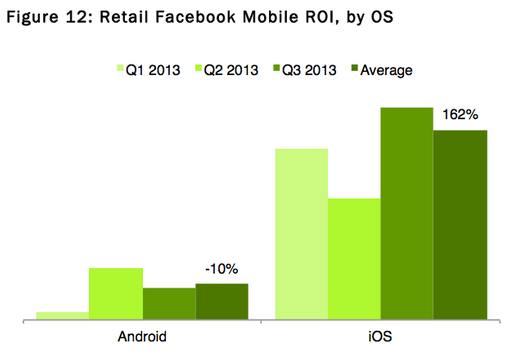
The decision was ultimately made to let the data speak for itself, and according to an article about the study in UberGizmo, “…Nanigans admits that the data that they have managed to gather is controversial and have declined to speculate in their report as to why the disparity is so great, but they do note that this will differ between industries.” This is important, because the disparity is not as dramatic in say, the gaming industry, compared to the retail industry (which is most of Nanigans client base, and who they are buying the bulk of media for) according to the report.
“Retailers are realizing significantly greater return from audiences on iOS than audiences on Android,” the report says. “For the first three quarters of 2013, RPC [revenue per click] on iOS averaged 6.1 times higher than Android and ROI [return on investment] on iOS averaged 17.9 times higher than Android.”
The data is structured around 4 overarching trends and key performance indicators used in the study include click-through rates (CTR), (CPM) or cost-per 1,000 impressions, cost-per-click (CPC), revenue-per-click (RPC) and Return-on-Investment (ROI).
“Incremental sales have become core to retailer Facebook advertising goals, and measuring the true ROI of these efforts is being increasingly demanded,” shared Marc Grabowski, COO of Nanigans. “While every retailer has a unique customer base and their results and strategies vary, we’re excited to offer a benchmark report specific to the sector with meaningful metrics and actionable strategy recommendations.”
Some other interesting highlights from the report include:
- 57% of retail desktop spend is delivered in News Feeds, with RHS continuing to deliver strong ROI (228%), showcasing support for a strategy coupling media buys in both delivery locations.
- 37% increase in CPM’s on average from first to last month of the quarter, highlighting an opportunity for retailers to increase budgets accordingly.
- 3X increase in the number of retailers tracking mobile revenues from Q1 to Q3, with almost 18% higher ROI for iOS than Android, suggesting retailers are focusing on understanding the quality and purchasing behaviors of mobile consumers.
- 28X higher CTR’s, yet 15% lower ROI for Facebook Exchange in News Feed vs. Right-hand side placement is one of many trends in the report showcasing that proxy metrics are not predictive of ROI.