What started almost 50 years ago as a partnership between Steve Jobs, Steve Wozniak and Ronald Wayne, has become one of the most iconic brands of our time. With an estimated brand value of close to a billion dollars, Apple is the most valuable and well-known tech company in the world.
Led by CEO Tim Cook, the California-based tech giant continues to roll out innovative products that fit seamlessly into its integrated system. Read on to discover 90+ Apple statistics across key areas such as production, usage, and revenue.
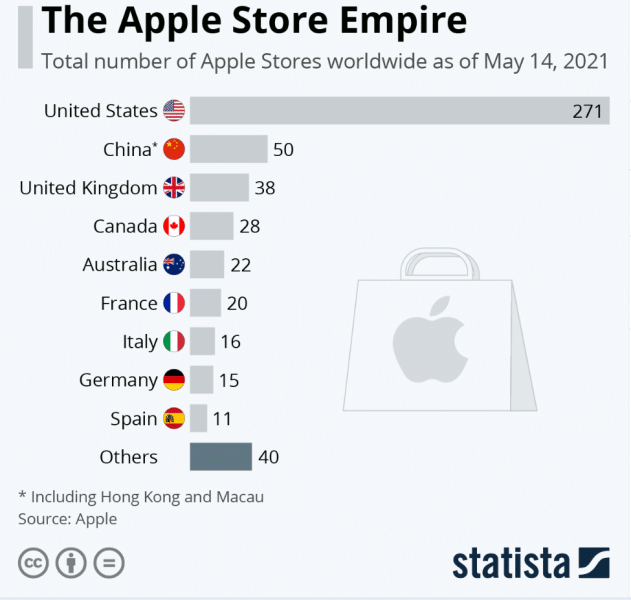
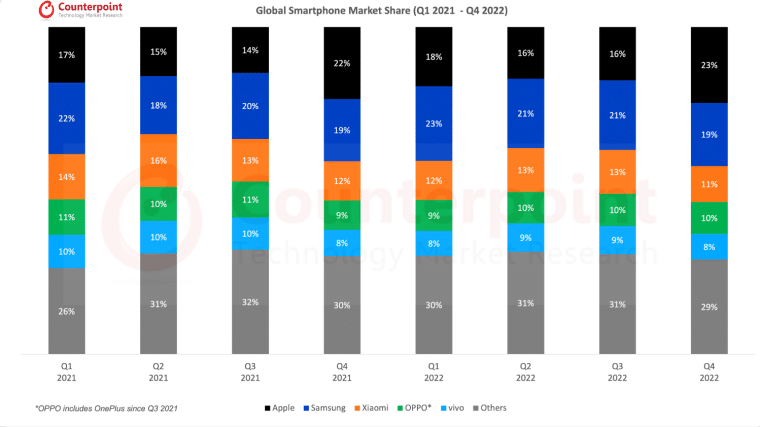
As of August 2024, Apple has had a busy year with a series of events and major product launches on the horizon, including the highly anticipated release of the iPhone 16 and advancements in artificial intelligence. The iPhone 16 series is expected to be unveiled in September 2024, with possible announcement dates around September 10th. This year’s lineup will include four models: iPhone 16, iPhone 16 Plus, iPhone 16 Pro, and iPhone 16 Pro Max. The iPhone 16 Pro Max is notably larger than previous models, with a display size increased to 6.9 inches. There are also exciting new color options, including a bronze-like “Desert Titanium,” set to replace Blue Titanium in the Pro models (MacRumors). Key features of the iPhone 16 include slimmer bezels, enhanced MagSafe technology, and better thermal designs to prevent overheating, which were issues that users had raised with earlier models. The Pro models will also feature a new vertical lens arrangement for the camera, adding a “Capture Button” to the side, allowing users to snap pictures more efficiently. One of the most anticipated updates, Apple Intelligence, the company’s upcoming AI software initiative, has seen delays. Although the iPhone 16 hardware is fully prepared to integrate with this new AI platform, the software itself is reportedly not yet ready for release. While the iPhone 16 is expected to launch as scheduled, Apple Intelligence is likely to roll out later in 2024 (MacRumors). The Apple Intelligence platform is poised to compete with major AI systems like Google’s Bard and Microsoft’s AI offerings. It is expected to be integrated across Apple devices to enhance user experience in everything from messaging to content creation and personal assistants. In addition to the iPhone 16 launch, Apple is expected to host its annual fall event in September 2024. This event will likely spotlight the iPhone 16 series, alongside potential updates to the Apple Watch lineup and new features in iOS. Later in the year, Apple may also introduce new iPads, with rumors suggesting significant updates to both hardware and software capabilities (MacRumors). These developments, alongside the much-anticipated Apple Intelligence software, make 2024 a pivotal year for Apple, as the company continues to innovate and compete in an increasingly AI-driven market. Apple received $250,000 initial funding during its incorporation. Apple Computer, Inc. was incorporated on the 3rd of January,1977. However, this was without Ronald Wayne, who sold his stake of the company back to Jobs and Wozniak for $800, just twelve days after co-funding Apple. Jobs and Wozniak received funding of $250,000 as well as business expertise from multimillionaire Mike Markkula. Between 1977 and 1978, Apple raised an additional $450,000 of seed funding from Sequoia Capital. This would see Apple grow at an average annual growth rate of 533% between 1977 and 1980 to become the leading computer manufacturer in the US. In 1979, Xerox bought 100,000 Apple shares at the pre-IPO price of $10 per share. This was in exchange for allowing Jobs and his team to look at the new technologies being developed at Xerox. On December 12, 1980, Apple went public and generated over $100 million. Apple sold 4.6 million shares at $22 per share ($0.10 per share when adjusting for 5 stock splits). The company generated over $100 million — more capital than any other IPO since Ford Motor Company in 1956. That same day, Apple’s share price hit $29 and, with a market cap of $1.78 billion, 300 millionaires were created. In June 1987 Apple had a 2-for-1 stock split. Apple’s pre-split stock price was $79. The split was payable June 15 to shareholders of record May 15 and allowed a broader group of investors to participate in Apple’s future. In 1997, Apple received a $150 million investment from Microsoft. This was part of Steve Job’s turnaround plan for Apple, which was on the brink of bankruptcy. The investment from Microsoft marked the start of an alliance to jointly develop new technologies and expand the lineup of Microsoft software for Apple’s Mac computers. At the height of the dot-com bubble, Apple had another 2-for-1 stock split. On June 21, 2000, Apple split its stock. The split came after share prices hit $101.25. A year after the split, shares were down 59.6%, underperforming the S&P 500’s 16.4% decline during the same period. Following the dot-com crash, Apple stocks gained momentum. The launch of the iPod in 2001 marked a new era for Apple and its share price increased over three-fold between 2001 and 2005. On February 28, 2005, Apple split its stock on a 2-for-1 basis. Apple split its stock again when prices hit $88.99, making its stock more accessible and attractive to individual investors. On June 9, 2014, Apple had a 7-for-1 stock split. This split came as Apple stocks had reached an impressive $645.57 per share. Post-split shares began trading at around $100, which made Apple stocks cheaper for a wider range of retail investors. In May 2016, Apple secured $1 billion in a Post IPO Equity Round. Apple received funding from Warren Buffett’s Berkshire Hathaway Corp in a rare venture into the tech sector. In September 2017, Apple sold debt amounting to $5 billion. Apple sold the debt to boost its domestic cash position and to fund its aggressive capital-return program. By August 2018, Apple’s shares were trading at $207.39, bringing the company’s market cap to over $1 trillion. In August 2018, Apple became the first US company to breach a $1 trillion market cap. Apple overtook big industry players like Facebook, Microsoft, and Amazon to hit the historic milestone. In August 2020, Apple doubled its value to reach a market cap of $2 trillion. Apple reached another significant milestone when its shares hit $468.65 on August 19, 2020, making it the first U.S. company to hit a $2 trillion valuation. In January 2022, Apple tripled its valuation in less than four years to reach a market cap of $3 trillion. After hitting a share price of $182.86, Apple became the first US company to reach a market cap of $3 trillion. As of May 2023, Apple is the world’s most valuable company by market capitalization. With a market cap of $2.68 trillion, Apple is the world’s most valuable company. Since its incorporation, the company has had 6 investors, including Berkshire Hathaway and Microsoft, and has raised a total of $6.2 billion in funding over 6 rounds. Apple is based in Cupertino, California, and has over 500 physical stores worldwide, with 271 in the U.S. alone. Additionally, Apple owns or leases facilities and land for corporate functions, R&D, data centers, and other purposes in locations throughout the U.S. and outside the U.S. As of 2023, Apple has 164,000 full-time employees led by CEO Tim Cook. Apple manages its business on a geographic basis, namely: Apple purchases components and materials from various suppliers then ships them to its assembling plant in China. When production is completed, products are shipped to Apple’s US warehouse, in Elk Grove, California, and other distribution centers located around the world. During 2022, Apple’s direct and indirect distribution channels accounted for 38% and 62% of sales, respectively. According to company reports, Apple uses direct and indirect distribution channels to sell its products. Direct distribution covers Apple’s own physical and online stores in key geographical markets. Indirect channels include third-party cellular network carriers, wholesalers, retailers, and authorized resellers. The world’s biggest iPhone factory is operated in central China by Foxconn. The Zhengzhou iPhone City production hub handles production and assembly, accounting for about 85% of iPhone production. Additionally, Apple relies on single-source outsourcing partners in Asia, the US, and Europe to supply and manufacture many components, and on outsourcing partners primarily in Asia, for final assembly of all of its hardware products. Apple plans to reduce its reliance on Asian production as early as 2024. Following supply chain disruptions in China caused by increased COVID curbs in November 2022, Apple is accelerating plans to source chips for its devices from a plant under construction in Arizona. The move is a major stride toward reducing its reliance on Asian production. According to Bloomberg, Apple may also expand its supply of chips from plants in Europe. Apple plans to expand its manufacturing capacity in India to produce 25% of all iPhones by 2025. In 2022, Apple moved 5% of its global iPhone 14 production to India. According to TechCrunch, Apple is looking beyond India to Vietnam, which will contribute… … by 2025. In the fiscal year 2022, Apple had over 200 suppliers worldwide. These suppliers represented 98% of Apple’s direct spend on materials, manufacturing, and assembly of products worldwide in 2021. According to Apple, all of its manufacturing is performed in whole or in part by outsourcing partners located primarily in Asia (mainland China, India, Japan, South Korea, Taiwan and Vietnam) and the US and Europe. Additionally, a significant concentration of this manufacturing is currently performed by a small number of outsourcing partners, often in single locations. Apple spent 20% more on research and development in 2022 As part of its bid to remain at the forefront of cutting-edge technology, Apple spent $26.25 billion on research and development in 2022. This is up from $21.9 billion in 2021 and $18.75 billion in 2020. According to Apple, the year-on-year growth in R&D expenses was driven by higher headcount-related expenses and engineering program costs. As of April 2023, Apple has decreased its comprehensive carbon footprint by over 45% since 2015. In total, Apple’s extensive environmental efforts to expand renewable energy across its global supply chain, and build products with recycled and other low-carbon materials have avoided over 28 million metric tons of carbon. 100% of Apple’s final assembly sites diverted 491K metric tons of waste from landfills, for a total of 2.01 million metric tons since 2015. According to Apple’s 2023 sustainability report, suppliers globally producing iPhone, iPad, Mac, Apple Watch, Apple TV, AirPods, HomePod mini, and Beats maintained their zero waste to landfill performance. In 2022, over 250 of Apple’s suppliers committed to transitioning to 100% renewable energy for Apple production. This represents over 9 gigawatts of clean energy brought online. Apple has reduced its gross carbon footprint by 45% since fiscal year 2015. Apple continues to increase supplier use of renewable energy, while reducing Scope 3 carbon emissions or all indirect emissions that occur in its value chain, including upstream and downstream activities. Nearly 20% of all materials used in Apple products in 2022 were recycled. This marked the highest-ever use of recycled content. Apple has also made significant progress toward its goal to eliminate plastics from its packaging by 2025, with plastics accounting for just 4% of packaging in 2022. Overall, since 2015, Apple has reduced plastic in its packaging by 75%. Apple plans to use 100% recycled cobalt in batteries by 2025. In 2022, Apple expanded its use of key recycled metals, and now sources over two-thirds of all aluminum, nearly three-quarters of all rare earths, and over 95% of all tungsten in Apple products from 100% recycled material. The move accelerates Apple’s progress toward its goal of achieving carbon-neutral products by 2030. Apple has registered over 1,000 trademarks for product logos, brand names, slogans, and more. Apple currently holds a significant number of patents, trademarks, and copyrights and has registered, and applied to register, additional patents, trademarks, and copyrights. Apple has over 72,054 patents globally. Filed between 2000 and 2023, Apple’s patents belong to 24,279 unique patent families. Out of 72,054 patents, 55,757 patents are active. In addition, most patents have been filed in the US (45,349) and in China (10,930). The patents cover the following key areas: As of March 2023, Apple made 29 investments. The most recent investment was on Mar 8, 2023, when Gamma raised $1B. Apple has made over 129 acquisitions. By 2021, Apple had acquired 100 companies. Now in 2023, the number is up to 129, with the most recent acquisition being WaveOne on March 27, 2023. Apple designs, manufactures, and markets smartphones, personal computers, tablets, wearables, and accessories, and offers a variety of related services. Apple’s five software platforms — iOS, iPadOS, macOS, watchOS, and TvOS serve millions of customers across the world and the tech giant leads the world in innovation with its expanding product ranges. In Q1 2023, Apple’s installed base crossed 2 billion active devices, and the company hit an all-time high for all major product categories. iPhone is Apple’s line of smartphones based on its iOS operating system. The iPhone line includes: As of Q4 2022, 72.3 million Apple iPhones have been sold globally. Between 2020 and 2022, the iPhone category accounted for an average of 51.58% of all sales. iPhones run on Apple’s mobile operating system, iOS, which is the second most popular smartphone operating system in the world. Mac is Apple’s line of personal computers based on its macOS operating system. The Mac line includes: Apple Mac shipments surpassed 26 million units in 2022. Mac made its debut in 1984, but the MacOS was released in 2001 and 19 versions have been released since. The retail price of the 2023 version of the MacBook Pro 14-inch is $1,999, while the 16-inch device retails at $2,499. The 2023 Mac mini is available for $599 and is the first of its model range to feature Apple’s custom silicon as opposed to Intel chips. As of Q1 2023, Mac sales account for about 10% of Apple’s revenue. iPad is Apple’s line of multipurpose tablets based on its iPadOS operating system. The iPad line includes: In Q4 2022, Apple shipped around 22.5 million tablets globally. The iPad was launched in 2010 and has released 29 versions of the device since then. The iPad pioneered the tablet market and uses the same operating system and multi-touch user interface as the iPhone and the iPod Touch. In 2022, iPad revenue accounted for about 25% of Apple’s total global revenue (the highest share to date). In Q1 2023, iPad sales make up about 8% of Apple’s total global revenue. Wearables, home, and accessories products include: Apple’s Wearables, home, and accessories category experienced a 7% growth in 2022 with AirPods and Apple Watches driving the highest sales. Apple sold over 90 million AirPods and 53 million Apple Watches in 2022. The number of Apple Watch users worldwide reached over 100 million in 2020 and the number of users continues to accelerate. During the first quarter of 2023, Apple announced a new iPad and iPad Pro powered by the Apple M2 chip, and a new Apple TV 4K. During 2022, Apple also announced the following new product, service, and software offerings: Apple provides services such as the App Store, Apple Music, Apple Pay, and iCloud. In 2023, Apple Services generated $80 billion in revenue, which is more revenue than Fortune 500 companies such as Nike, Boeing, Coca-Cola, or McDonald’s, and set a new all-time revenue record. Apple’s services are integrated with its hardware, binding users to the Apple ecosystem. Because users can do anything within Apple’s tightly knit system, they’re less likely to buy non-Apple devices when looking to purchase a new smartphone, laptop, tablet, or smartwatch. Apple’s advertising services include various third-party licensing arrangements and its own advertising platforms. Apple currently owns 15% of overall app developer spend on online advertising. Google remains at the top, with 34%. Facebook is second at 28%, followed by Apple, which is gaining momentum. While Facebook and Google are losing steam, Apple’s ad platform for app developers is on the rise. Apple offers a portfolio of fee-based service and support products under its AppleCare brand. This gives customers access to Apple technical support, the global Apple authorized service network for repair and replacement services, and additional coverage for accidental damage, theft, and loss, depending on the country and type of product. In 2020, AppleCare sales exceeded three percent of revenue. By the end of 2021, AppleCare sales had fallen just below 3% of revenue. Apple’s cloud services store and keep customers’ content up-to-date and available across multiple Apple devices and Windows personal computers. Apple offers various digital platforms, including: In Q4 2022, Apple’s App Store had 1.76 million apps and 460,000 games. Launched in 2008, the Apple App Store offers over one million gaming apps. Games, business, and education are the top three most popular app categories in the Apple App Store. Games make up 21.06% of the store while free apps make up a massive 94.1%. iOS subscriptions reached 900 million in 2022. This is up 20% from 745 million in 2021. Apple Arcade reached nine-figure subscribers in 2022. The gaming platform has over 200 games and continues to expand its reach. Apple Music had 88 million users in 2022. This makes Apple Music the second-largest music streaming service behind Spotify with 150 million users. As of 2022, Apple News has over 125 million monthly active users. Launched in 2019, Apple’s news service doesn’t account for much revenue, but continues to add more readers every year. Apple TV+ had 75 million subscribers as of March 2022. According to Statista, about 25 million of these users are paid subscribers, while the other 50 million users access the platform via promotions, such as ‘free for one year’ with the purchase of new Apple devices. Apple offers payment services, including Apple Card, a co-branded credit card, and Apple Pay, a cashless payment service. Apple Pay had over 507 million active users in 2022. Released in 2014, Apple Pay breached 507 million active users in 2022. As of March 2023, people using the iPhone’s Wallet app can borrow anywhere from $50 to $1,000 using Apple Pay Later. According to company reports, Apple’s revenue is split between products and services. Between 2020 and 2022, products have accounted for the bulk of Apple’s total net sales. In 2022, for example, product sales accounted for 80.93%, while services made up the remaining 19.07% Net product sales increased by 6% between 2021 and 2022. Because of the addition of different products and greater demand, product sales increased from $297.39 billion in 2021 to $319.19 billion in 2022. Net services increased by 14% between 2021 and 2022. Services increased from $68.43 billion in 2021 to $78.13 billion in 2022. This is mainly because of a different services mix and improved leverage. Q1 2023 total net sales figures show a 5.48% decline compared to the same quarter in 2022. This comes as turbulent macroeconomic conditions continue to affect iPhone and Mac sales in 2023. in billions in billions in billions Total net sales increased by 8% or $28.5 billion in 2022. Net sales increased from $365.82 billion in 2021 to $394.24 billion in 2022. This was due to higher net sales in the iPhone, Services, and Mac product categories. Apple sold 7% more iPhones in 2022 than in 2021. This was due to higher net sales of Apple’s new iPhone models released since the beginning of Q4 2021. 14% more Macs were sold in 2022 compared to 2022. Apple attributes the higher sales figure to increased laptop sales. iPad sales decreased by 8% in 2022. This is down due to lower net sales of the iPad Pro. Net sales of wearables, home, and accessories increased by 7% in 2022. Wearables, home, and accessories net sales include sales of AirPods, Apple TV, Apple Watch, Beats products, HomePod Mini, and accessories. Net sales increased during 2022 because of higher net sales of the Apple Watch and AirPods. Net sales of Services increased by 14% in 2022. Services net sales include sales from advertising, AppleCare, cloud, digital content, payments, and other services. The growth in services net sales during 2022 was mainly due to higher net sales from advertising, cloud services, and the App Store. Apple tracks revenues primarily through 5 key geographical segments: the Americas, Europe, Greater China, Japan, and the Rest of Asia-Pacific. In 2022, the Americas were Apple’s best-performing segment. With over $168.65 billion in sales in 2022, this reflects an 11% increase from 2021. With $95.12 billion and $74.20 billion in sales respectively, Europe and Greater China had the second- and third-best sales figures. Overall, compared to Q1 2022, total net segment sales decreased by 5%. The performance of each segment, according to Apple’s Q1 2023 report, is as follows: America’s net sales decreased 4% in Q1 2023 compared to the same quarter in 2022. Due to lower net sales of iPhone and Mac net sales in the Americas decreased from $51.47 billion in Q1 2022 to $49.27 in Q1 2023. Europe’s net sales decreased by 7% during the first quarter of 2023 compared to the same quarter in 2022. Apple attributes the dip from $29.75 billion in Q1 2022 to $27.69 billion in Q1 2023 to lower net sales of iPhones and Macs and the weakness in foreign currencies relative to the U.S. dollar. in billions in billions in billions Greater China’s net sales are lower by 7% during the first quarter of 2023 compared to the same quarter in 2022. The decrease from $25.74 billion in Q1 2022 to $23.91 Q1 in 2023 is because of the weakness of the Renminbi relative to the U.S. dollar, which contributed to lower net sales of iPhone. Japan’s net sales decreased 5% during the first quarter of 2023 compared to the same quarter in 2022. Apple reported the negative change was because of the weakness of the yen relative to the U.S. dollar, which contributed to lower net sales of Services and Macs. Net sales in the Rest of the Asia Pacific fell by 3% during the first quarter of 2023 compared to the same quarter in 2022. This is mainly because of the weakness in foreign currencies relative to the U.S. dollar. The weakness in foreign currencies contributed to lower net sales of iPhones and Macs. Apple has over 2 billion active devices as part of its growing installed base. While this represents a sizable install base of iOS, macOS, and other Apple devices, Android still leads with over 3 billion active Android devices. Apple’s demographic is young. According to Flurry Analytics, Apple users are typically aged between 18 and 45. The brand is most popular among Millennials and Gen Zs. 53% of all Apple mobile users are under the age of 35, compared to only 28% for Samsung. Gen Zs show the strongest preference for Apple even though they still make up a small percentage of the world’s total smartphone audience. 32% of all Gen Zs own an iPhone, compared to only 21% for Samsung. Globally, two-thirds of all Apple device owners are female. The study by Flurry Analytics also showed that Apple has 66% female customers versus 34% male customers. The brand appeals to Millennial and Gen Z females, with over 4 times as many female Millennials using Apple devices versus Samsung. Additionally, twice as many Gen Z females use Apple over Samsung. The figures are reversed for Samsung, with men making up 62% of their mobile device audience. Apple’s customers are more affluent than those on competing platforms. Apple users are affluent, with a high representation of creatives and knowledge workers. For example, US iPhone users make $88,256 per year, while Android users make $69,647. In addition, 35% of Apple users have household incomes over $100,000 a year. iPhone users are also three times more likely to have a total household income of over $300,000 per year. China has the highest number of active iPhone users worldwide. In 2021, iPhone users in China breached 342 million active users, accounting for almost 25% of iPhone users worldwide. Other countries boasting a loyal Apple user base include the US, Japan, and the United Kingdom. In the US, 23% of laptop users own a Mac. 58% of MacBook users in the US identify as female, with 31% of the user base falling within the 25 to 34 age group. 53% of MacBook users in the US live in town and rural areas, while 30% live in large cities. In Q1 2023, Apple was the fourth-largest personal computer vendor by unit sales. Apple shipped 14.2% of all PC units in the US to rank fourth among vendors for US PC shipments in Q1 2023. Apple held the largest share of the global smartphone market by shipments in the last quarter of 2022. Driven by the recent launch of the iPhone 14 series, Apple beat Samsung and Xiaomi for the top spot, shipping 225 million iPhones worldwide in Q4 2022. Apple’s smartphone market share in 2022 was 18.8%. Apple came in second while Samsung retained its position as the market leader in the global smartphone market with a 21.6% share of all shipments. Apple Mac’s PC market share as of 2022 was 9.8%. This is just around 10% of the total number of PC shipments in the entire PC market. Apple’s largest market share is in the Americas. Bringing in just over $37 billion in net sales in Q3 2022, the Americas segment is Apple’s best-performing segment. Apple’s iOS held a 27.6% market share as of Q4 2022. In the fourth quarter of 2022, iOS accounted for around 27.6% of the mobile operating system market. Android maintained its position as the leading mobile operating system worldwide with a 71.8% share. Apple dominates the smartwatch market. In 2022, Apple shipped close to 46.6 million units in the fourth quarter, making it the leading smartwatch vendor. While it has a 33.6% share of the market, Apple faces tough competition from many vendors entering the market, especially from China. In September 2022, Apple’s TV streaming market share hit 6%. Apple TV+ market share breached 6% in September 2022 while other competitors, such as Netflix, lost numbers. However, Netflix still holds a 27% share of the TV market, despite losing a record number of subscribers in the past year. In November 2022, Apple’s Safari browser had a 25% market share. While Apple outperforms Google in terms of brand value, Google still holds the lead in the mobile browser category, with a market share of nearly 62%. Apple – Key Stats
Latest Updates on Apple in 2024
iPhone 16 Release
Apple Intelligence Delays
Upcoming Events
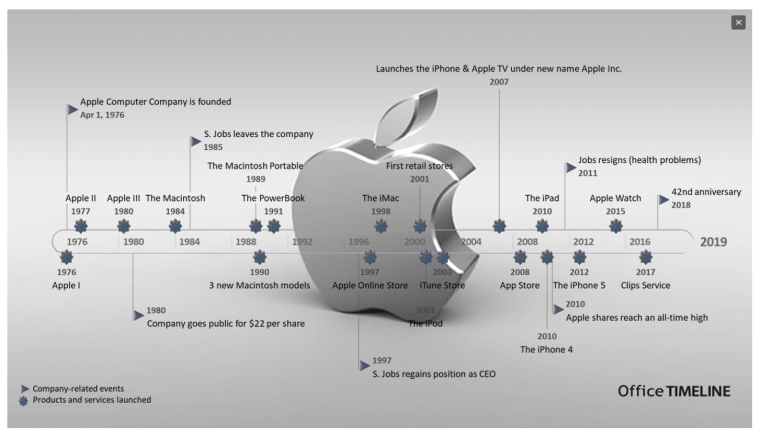
Apple Timeline and History
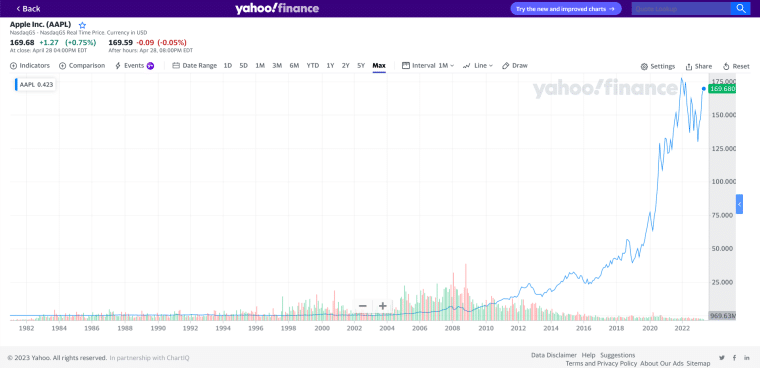
Apple Investment Data
Rank Company Market Cap as of May 2023 Country 1 Apple $2.68 T USA 2 Microsoft $2.27 T USA 3 Saudi Aramco $2.08 T Saudi Arabia 4 Alphabet (Google) $1.36 T USA 5 Amazon $1.05 T USA Apple Business Data
Apple Production and Distribution Data
Research and Development Statistics
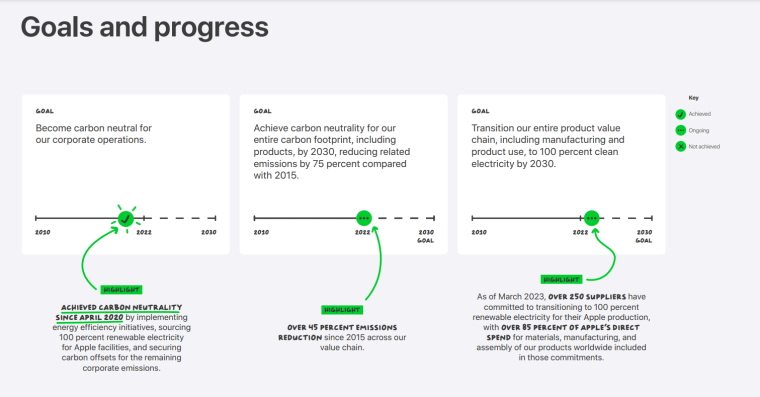
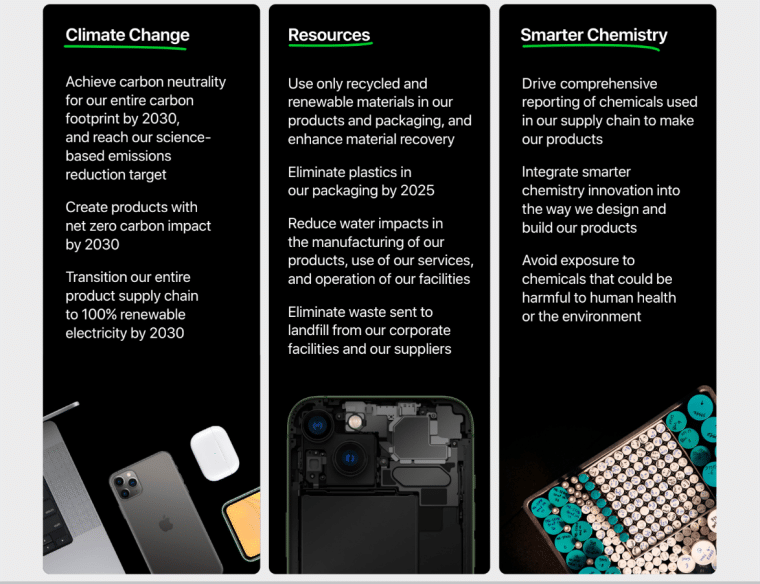
Sustainability Statistics
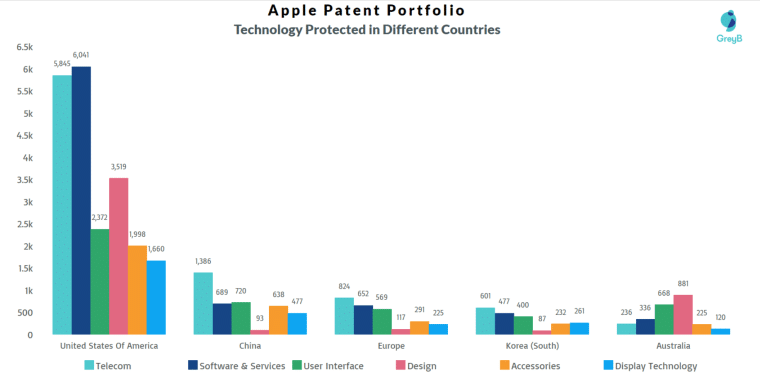
Innovation Statistics
Investments and Acquisitions Data
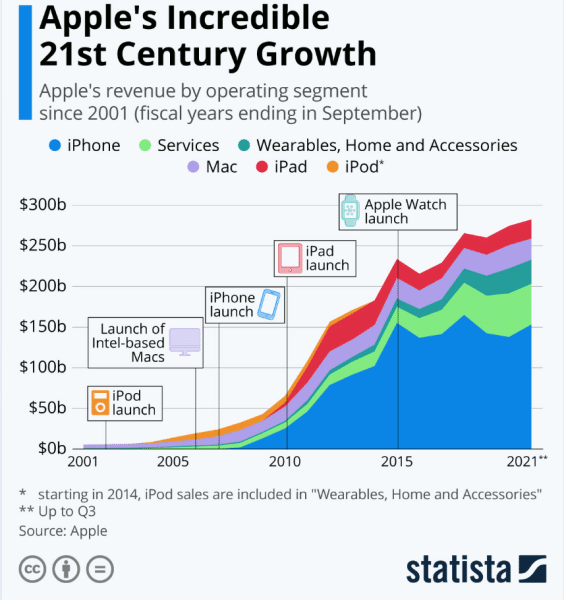
Apple Product Stats
Products
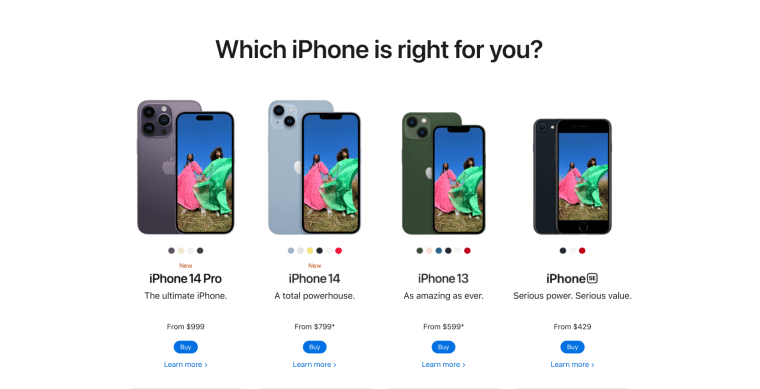
iPhone
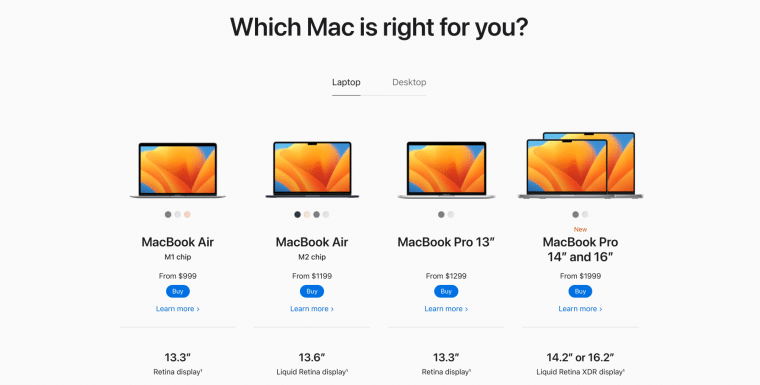
Mac
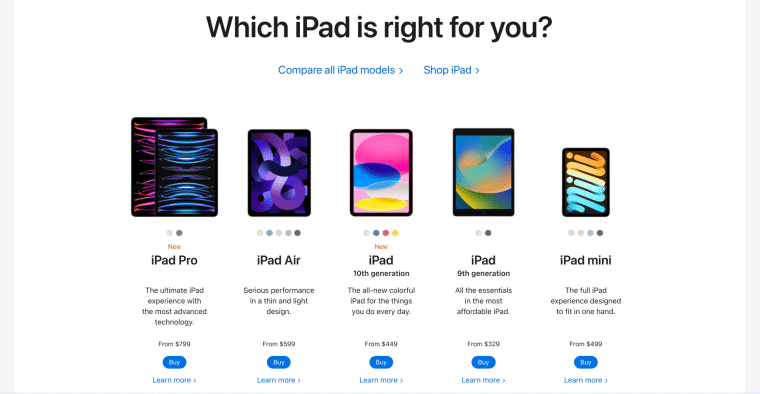
iPad
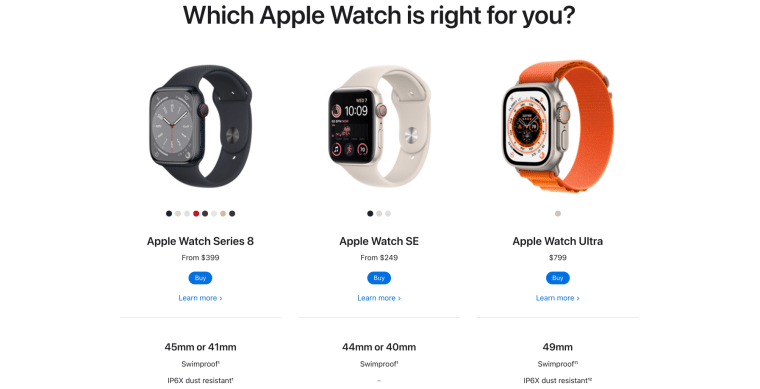
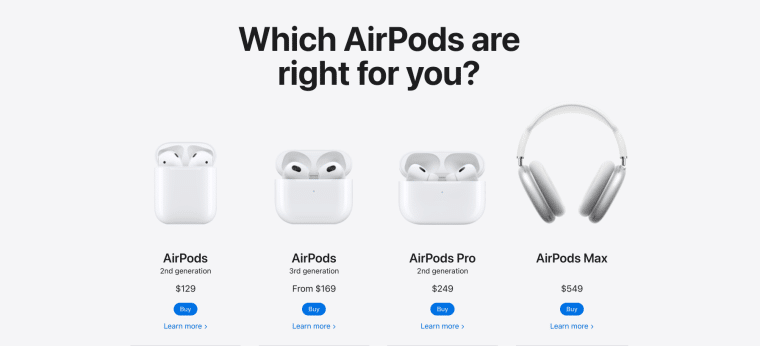
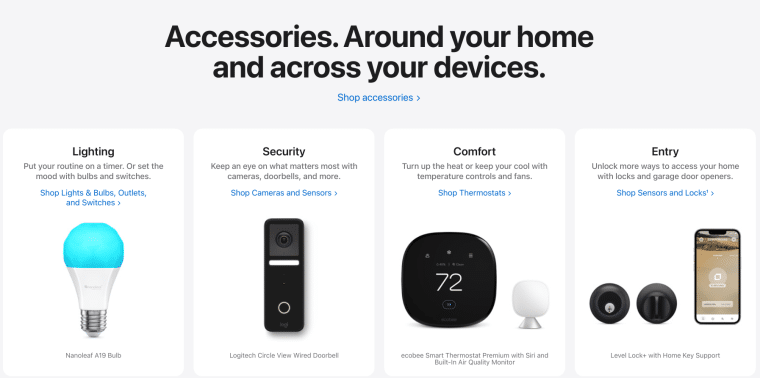
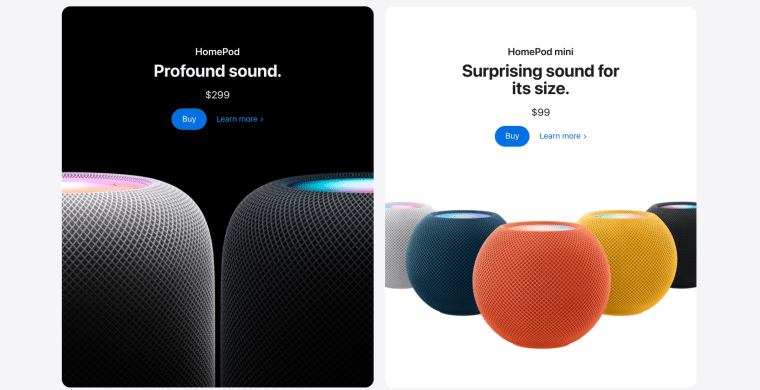
Wearables, Home & Accessories
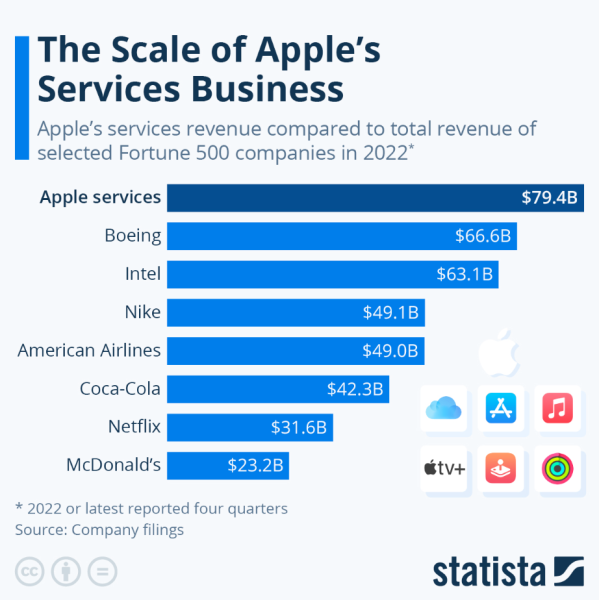
Services
Advertising
AppleCare
Cloud Services
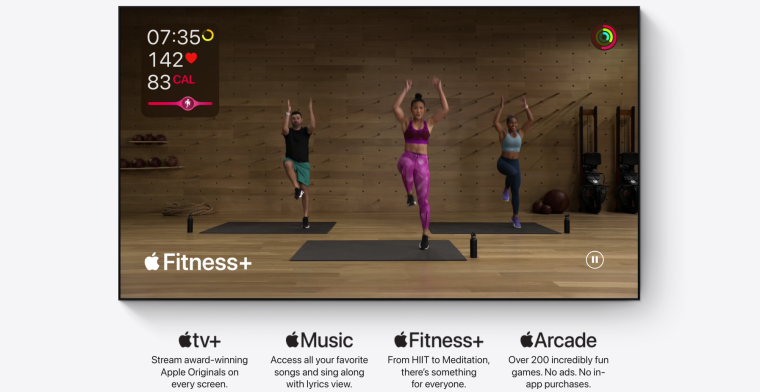
Digital Content
Service Year Launched Cost per month Apple TV 2007 $6.99 App Store 2008 *Costs of apps vary Apple Books 2010 *Costs of titles vary Apple Podcasts 2012 Free Apple Music 2015 $10.99 Apple Fitness 2015 $9.99 Apple Arcade 2019 $4.99 Apple News 2019 $9.99 Payment Services
Apple Sales Statistics
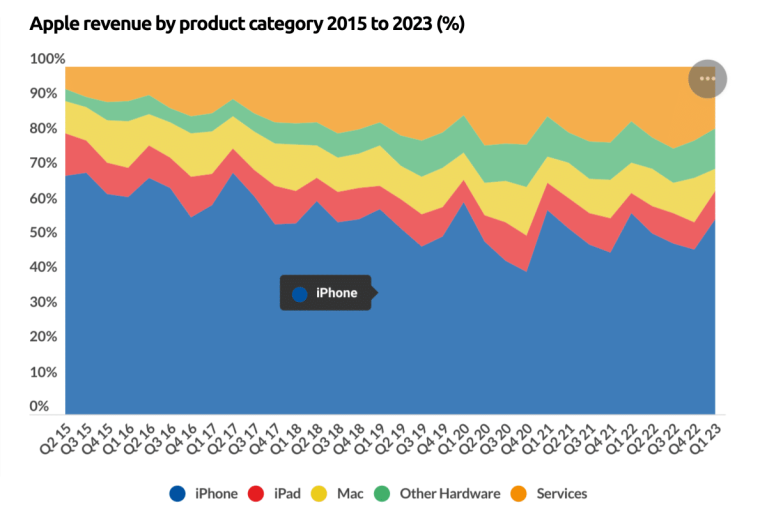
Net Sales by Category 2022 YoY Growth 2021 YoY Growth 2020 iPhone $205.49 7% $191.97 39% $137.78 iMac $40.18 14% $35.19 23% $28.62 iPad $29.29 -8% $31.86 34% $23.72 Wearables, Home, and Accessories $41.24 7% $38.34 25% $30.62 Services $78.13 14% $68.43 27% $53.77 Apple Product Category Statistics
Segment Statistics
Q1 2023 Segment Statistics
Net Sales by Segment 2022 YoY Growth 2021 YoY Growth 2020 Americas $168.65 11% $ 153.31 23% $124.56 Europe $95.12 7% $89.30 30% $68.64 Greater China $74.20 9% $ 68.36 70% $40.31 Japan $25.9 – 9% $ 28.48 30% $ 21.42 Rest of Asia-Pacific $29.38 11% $ 26.56 30% $ 19.59 Apple Demographics Data
Apple vs Competitor Stats
Product Key Competitors Smartphones PCs Wearables, Home, and Accessories Subscription Services Digital Content Advertising Payment Services 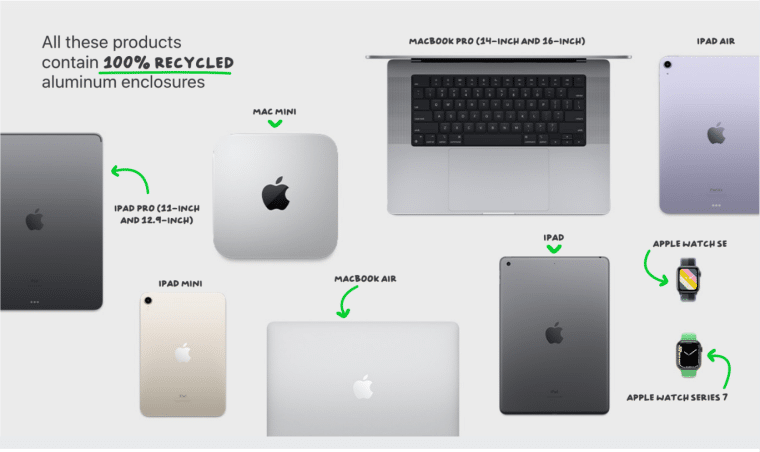
References