Email marketing has established itself as one of the most effective digital marketing channels for businesses around the globe. With its ability to reach a wide audience, build relationships, and generate significant returns on investment, understanding the intricacies of email marketing is crucial.
There’s no shortage of data on email marketing. However, sifting through the vast amount of information spread across numerous reports and websites can be quite a daunting task. That’s why we’ve compiled over 100 email marketing statistics, bringing together key insights on open rates, click-through rates, conversion rates, return on investment (ROI), and much more.
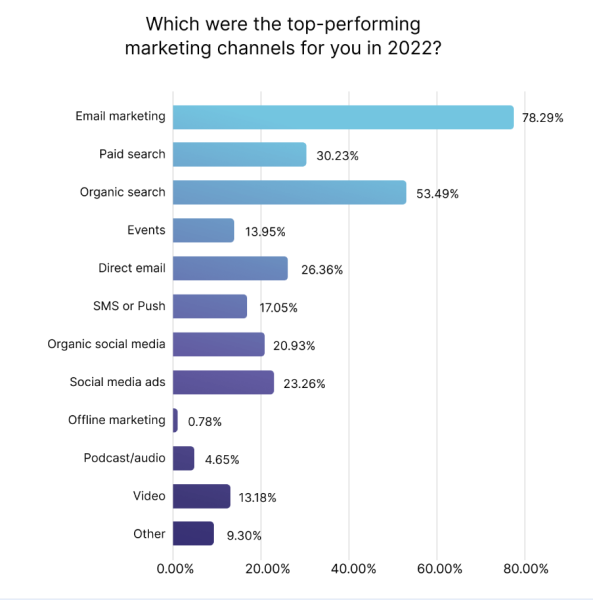
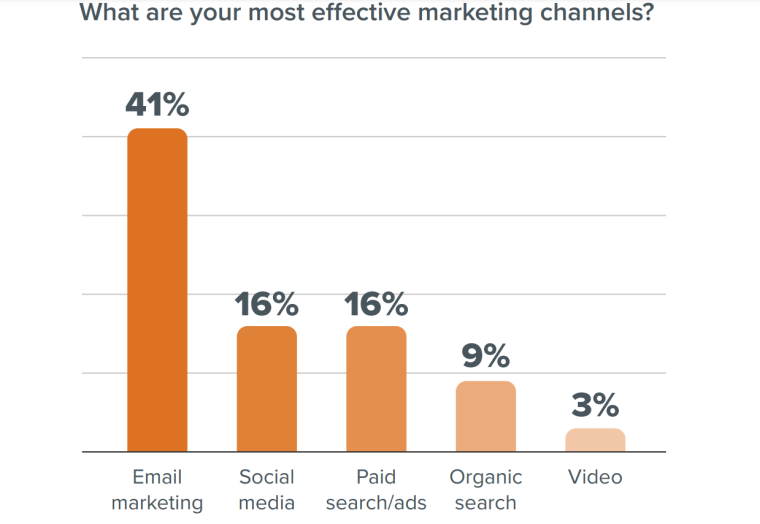
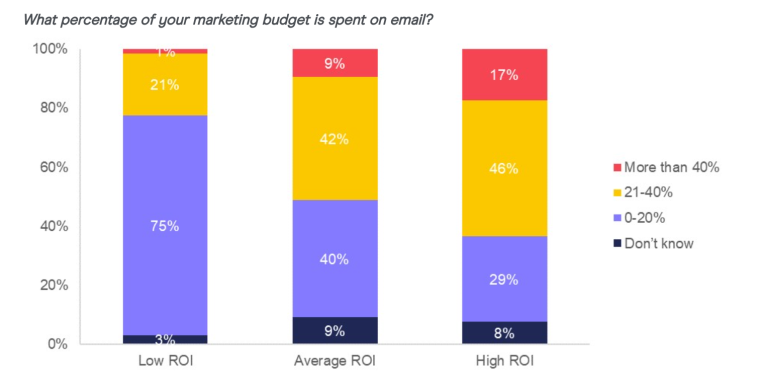
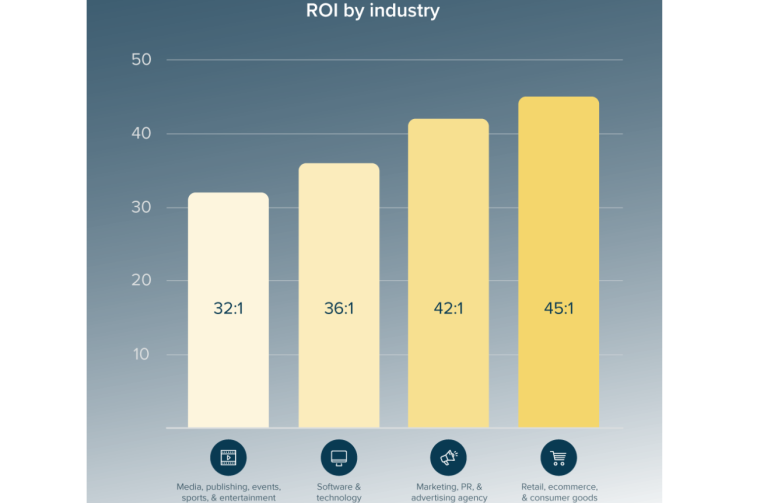
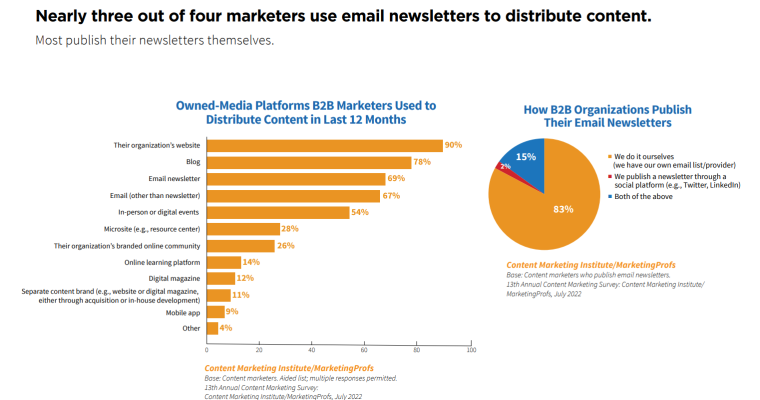
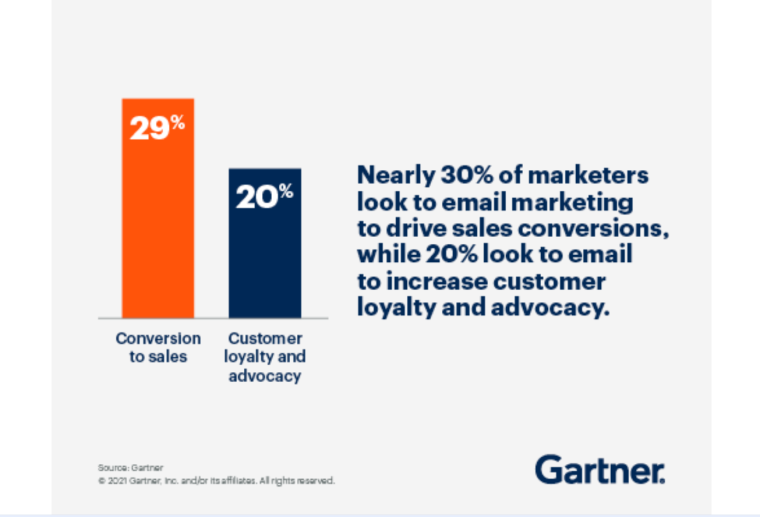
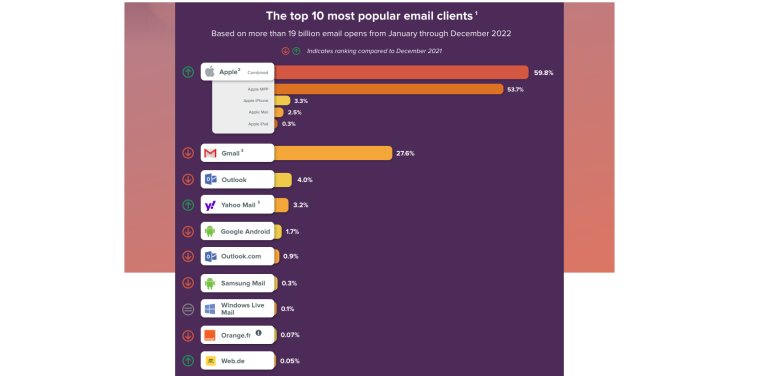
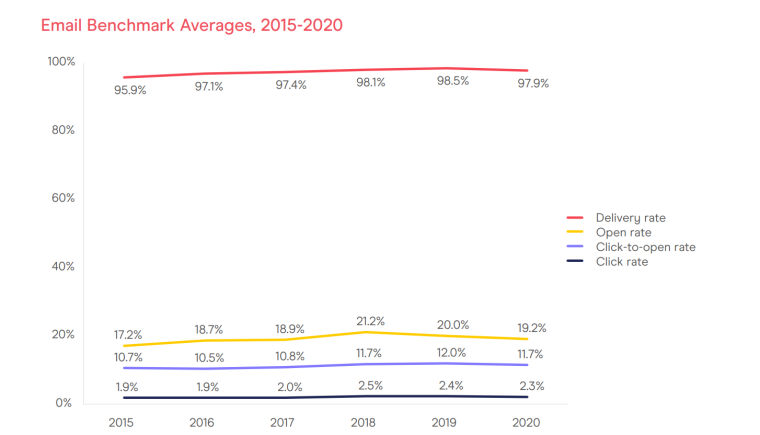
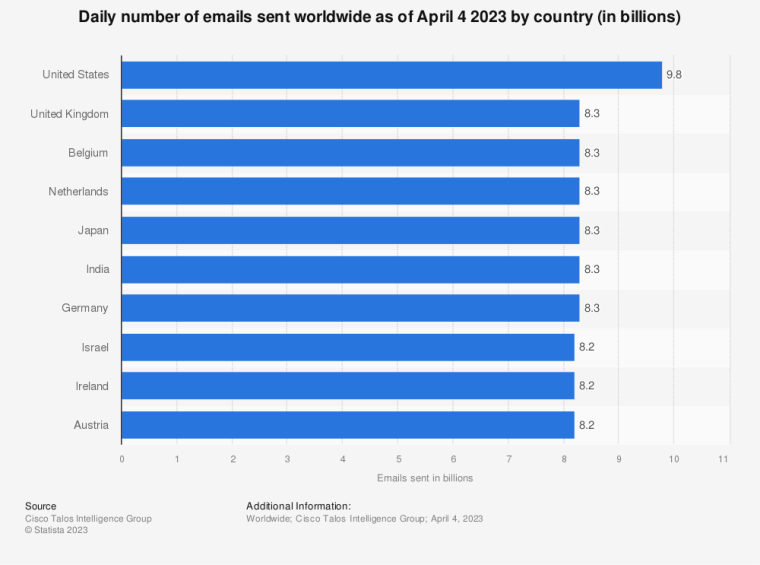
Over 80% of industry experts used e-mail newsletters as part of their marketing strategies in 2022. Additionally, over 60% of marketers indicated that their email campaign open rates improved in 2022, demonstrating email marketing’s continued success as a digital marketing channel. Email marketing can reduce an organization’s carbon footprint by up to 90%. This is compared to traditional marketing methods such as direct mail. 24% of marketers identified measuring email ROI and performance as one of the top three challenges of email marketing. 70% of marketers monitor click-through rates (CTRs) to measure the success of their email campaigns, while 60% keep track of conversion rates. Email marketing had an ROI of between $35 and $40 for every $1 spent in 2022. This hasn’t changed much from 2015, when the data and marketing association reported that email had an average ROI of about $38. At $45 for every $1 dollar spent the retail, e-commerce, and consumer goods industry had the highest ROI from email marketing. This was followed by the marketing, PR, and advertising agencies sector, which got $42 for every $1 spent. At $36 for every $1, the software and technology industry came in third place. In terms of ROI, Litmus discovered that marketers who: In a 2022 Statista poll, around 50% of marketing professionals surveyed reported a 2x improvement rate in their email marketing campaigns’ ROI. As very few channels can compete with email marketing’s average return on investment (ROI), it remains a key part of any digital marketing strategy today. Constant Contact analyzed over 200 million emails and as of June 2023, reported that the overall average open rate across all industries was 34.46%. Email open rates refer to the percentage of recipients who open an email message compared to the total number of emails delivered to inboxes. Industry-wise, faith-based organizations recorded the highest average open rate of 44.11%, closely followed by childcare services at 43.87%. Campaign Monitor analyzed over 100 billion emails sent across its platforms in 2021 and found that the average email open rate across all industries was 21.5% that year. This reflects a 3.5% increase from 2020. The same report revealed that the average email CTR was 2.3%, across all industries, down 0.3% from 2020. Email click-through rate measures the percentage of email recipients who click on a link compared to the total number of delivered emails. It also reported that the click-to-open rate was 10.5% across all industries in 2021, down 3.6% from 2020. Click-to-open rate is a measure of the effectiveness of email campaigns based on the percentage of email recipients who clicked on a link within an email compared to the total number of email opens. According to Netcore, the average inbox placement rate across industries was 92% in 2022. The information tech and service industry had the highest inbox placement rate at 98%, while the media publishing industry had the lowest inbox placement rate at 73%. Inbox placement rate is used to measure the percentage of emails that successfully reach recipients’ inboxes as intended, without being filtered into spam or junk folders. GetResponse analyzed almost 7 billion messages out of nearly 30 billion emails for its 2023 Email Marketing Benchmarks report and uncovered the following key insights regarding email security and privacy: The average bounce rate across industries was 1%. High bounce rates (anything above 5%) can be extremely damaging to an email marketing campaign. The banking, mutual funds, and securities industry had the highest bounce rate at 2.7%, while the gaming industry had the lowest bounce rate at 0.2%. The average unsubscribe rate across industries was 0.06%. The dating industry had the highest unsubscribe rate at 0.37%, while edtech and educational institute industries had the lowest at 0.01%. Unsubscribe or churn rate refers to the rate at which the email recipients opt out of or unsubscribe from a brand’s mailing list as a percentage of the total number of subscribers on an email list. Generally, while a 5% annual churn rate is considered low, it is more favorable to ensure it is lower. According to Litmus’ 2023 State of Email Workflows report, email marketing was the most effective marketing channel according to 41% of all respondents. This is followed by social media (16%), and paid search (16%). Email leads by a wide margin, with the average email team sending as many as 15 emails per month. The Content Marketing Institute states that up to 69% of marketers use email marketing to promote content. That makes email the third most popular content distribution channel, just behind company websites (90%) and blogs (78%). RSS emails perform best, with an open rate of 44.54%, a CTR of 7.24%, and an unsubscribe rate of 0.05%. In second place are autoresponder emails with an open rate of 35.9%, followed by triggered emails. While newsletters have the lowest open rates at 26.7%, they have the second lowest unsubscribe rate, at 0.09%. With a 94% open rate and a 31.43% CTR in 2023, the single email autoresponder cycle yielded the best results. GetResponse’s research reveals that shorter email marketing drip campaigns tend to produce better results. The average open rate for all email newsletters sent in 2022 (27.9%) was almost 1.5x higher than in 2021 (19.3%). While 46% of marketers in 2023 compared to 45.7% in 2022 opt to send one weekly newsletter, this yields the highest unsubscribe rates. GetResponse’s data shows that the lowest unsubscribe rates and the highest click-through rates are seen by marketers who send as many as 8 newsletters per week. A 2022 Mailjet report found that 63% and 59% of marketers, respectively, believed content quality and personalization were critical to improving email engagement. At 35%, responsive design took the third spot among marketers. The same report reported the following email KPIs for all its respondents: In a mobile-first world, the optimum subject line length with the highest open rates is 30-35 characters, including spaces. According to Netcore’s report, lines beyond 36 characters automatically cut off the description and may negatively affect open rates. Meanwhile, GetResponse found that 61-70 characters yielded the highest open rates overall. The use of emojis in mobile and email marketing messages has increased by 775% year-over-year. 56% of brands using emojis in their email subject lines had higher unique open rates. By using emojis in place of words, or to complement words, marketers have introduced a new way to engage and connect with consumers. 76% of email deliverability problems can be attributed to data issues. While a host of factors such as volume, frequency, creatives, and bounces, affect email deliverability, unclean databases put brands on the blacklists of ISPs, undermine sender reputation, and derail marketing campaigns. In 2022, nearly 49% of all e-mails worldwide were identified as spam, up from 46% in 2021. Spam emails remain a large part of email traffic, but their share has declined significantly since 2011. In 2022, the highest volume of spam emails was registered in February, at about 53% of email traffic worldwide. The most common type of spam is marketing/advertising emails which account for nearly 36% of all spam emails. For its 2023 Email Benchmark Report, Netcore analyzed 100 billion emails and findings on email metric benchmarks from 7 regions and 20 industries. The average open rate across industries was 24%. In addition, the retail industry had the highest open rate at 51%, while the gaming industry had the lowest open rate at 12%. The same report found that the average click rate across industries was 1%. The dating industry had the highest click rate at 3.5%, while the gaming, loyalty, and medtech/ e-pharmacy industries had the lowest click rate, at 0.1%. Further, the average click-to-open rate across industries was 3%. The dating industry had the highest click-to-open rate, at 11%, while the retail industry had the lowest, at 0.5%. 2023 data by Brevo revealed that: According to a 2022 Campaign Monitor report, the industries with the highest open rates in 2021 averaged between 25-28% and included: The same report also found that the industries with the highest click-through rates in 2021 averaged between 3-5% and included: The report further found that the top 5 industries with the highest click-to-open rates in 2021 averaged between 14-17% and included: Gartner surveyed over 400 CMOs and marketing leaders in 2023 and found that 41% planned to increase their email marketing investment. Meanwhile, 19% planned to decrease their investment. 83% of B2B marketers used email engagement to track content performance in 2022. However, according to Insider Intelligence, many marketers focus on the wrong metrics to gauge the success of their email campaigns. According to Gartner, the most utilized digital channel for B2B marketing in 2022 was email marketing. This was followed by social advertising and SEO, highlighting the effectiveness of these channels post-pandemic. According to a 2021 Email Benchmarking report, for emails sent in a B2B context, email delivery rates stood at 99.2% in 2020, the highest registered since 2015. The same report also found that: According to Dream Data, email clicks account for over 40% of closed B2B deals. B2B customer journeys take an average of 190 days from the first email click to the close of a deal. Meanwhile, only 6% of qualified leads have an email click as their first touch and 2% as their last touch. The percentage of email clicks increases as accounts move through the pipeline: A 2023 survey by Digital Commerce 360 and Bizrate Insights found that email is still a major influence on online buying behavior. Among survey respondents, 43% said emails suggesting items previously viewed were on sale were most influential. Other influential email types were: The same survey revealed that 50% of shoppers open email advertising at least daily. Meanwhile, 25% view advertising emails at least a few times a week, 9% weekly, and 6% monthly. It was also found that over 30% of online shoppers purchase at least weekly due to email marketing. 16% of respondents reported doing so daily or even more. Furthermore, 20% purchased a few times a week, 23% did so monthly, and the remaining 32% a few times a year. Promotion-driven emails and order-related communication saw the highest open rates. The top-three email types were: Research by Gartner found that 30% of marketers look to email marketing to drive sales conversions. Additionally, 20% look to email marketing to increase customer loyalty and advocacy. Brands in the top 20% of retail had over 1.4 million monthly site visits from email in 2021. This is compared to just 212,000 in the travel and hospitality industry and 127,521 in the financial services sector. According to Validity’s 2021 Email Benchmarking Report, the B2C email delivery rate fell from 98.8% in 2019 to 97.0% in 2020. The report also found that: According to Netcore, the email unsubscribe rate for e-commerce businesses was 338 per 100,000 users in 2020. The industry with the highest unsubscribe rate was the entertainment industry with 979 per 100,000 users, while the industry with the lowest unsubscribe rates was the telecom industry with 777 per 100,000 users. Constant Contact surveyed thousands of consumers to discover the reasons they unsubscribed from emails and found that: Consumers purchasing via an email link spend on average 138% more than other customers. Email marketing continues to drive revenue for e-commerce businesses as consumers tend to spend more when led to e-commerce sites via email links. In 2022, the open rate for e-commerce email marketing campaigns was 22.94%. This is compared to 10.16% in 2020. E-commerce email click rates were 1.23% in 2022. This is down from 1.37% in 2021. E-commerce players achieved a click-to-conversion rate of approximately 56.8% for welcome messages in 2022. Additionally, the rate for automated cart abandonment emails was recorded at 44.4%. Conversion rates for e-commerce email marketing were 0.08% in 2022. That represents a decrease from 0.10% in 2021. Despite the decline, e-commerce players experienced reasonable success with a 6.34% click-to-conversion rate for campaign emails. Automated welcome emails sent by e-commerce players had a conversion rate of 3% in 2022. Meanwhile, automated cart abandonment emails had a conversion rate of 2.39%. According to Brevo, e-commerce businesses have the highest unsubscription rates. However, they tend to have the lowest email bounce rates. According to a 2023 report by Neon One, the average non-profit had an email list size of 4,191 contacts. The average small nonprofit’s email list had 547 contacts while the average large nonprofit’s email list had 6,602 contacts. The same report found that 50% of donors preferred email for receiving appeals and updates. A further 26% of donors said email actually inspired them to give, outpacing social media, websites, and print materials. The average nonprofit raised $5,598.51 per email campaign. Small nonprofits raised around $3,500 while larger nonprofits raised over $6,500 per email campaign. While larger nonprofits raised $0.88 per email contact, small nonprofits raised up to 6 times more. The average small nonprofit raised up to $6.15 per email contact, compared to the industry average of $1.11 per email contact. Meanwhile, the average nonprofit email open rate was 28.59%, up from around 26% in 2021. That’s considerably higher than the 21% open rate for business/for-profit organizations as nonprofit audiences are generally more invested in the emails they receive. For smaller nonprofits, the open rate jumped to over 45%. The average nonprofit’s click-through rate was 3.29%. Small nonprofits have a click-through rate of 10.24% while larger nonprofits had a rate of 2.91%. The report also found that the bounce rate for the average nonprofit was around 1.72%. This means for every 100 contacts on a list, fewer than two emails were undeliverable. The average nonprofit’s unsubscribe rate was 0.19%. This is consistent with the 0.17% – 0.2% unsubscribe rate for businesses/for-profit organizations across various industries. Wednesdays and Fridays were the best days to send emails to engage donors. The click-through rates for both days were 3.58% and 3.68% respectively. The subject line emotions that prompted the best open rates were: According to 2023 research by GetResponse, overall global click-through rates were lower compared to previous years. Email marketers operating in Oceania, however, saw an open rate of up to 38%. However, 2022 was not a good year for South America, which saw significant drops in almost every metric, including unsubscribes, spam complaints, and bounce rates. The Asia-Pacific region, in particular, had the highest email engagement rates, at 22.4%. The region also had the highest unsubscribe rates at 0.3%. While email users in the region are now more open to email marketing, they’re also cautious about who they allow into their inboxes. In Europe, North America, and Asia-Pacific, email marketing was the most widely used technology for customer engagement, at 77.6%. This is compared to 62% for content management and 61% for social media. GetResponse found that Asia had the following email marketing KPIs in 2022: The same research found that Africa and the Middle East had the following email marketing KPIs in 2022: As of January 2023, the country with the highest number of spam emails sent per day worldwide was the US, with around 8 billion. Czechia and the Netherlands came in second and third, with 7.7 billion and 7.6 billion, respectively. 55% of US consumers make a direct purchase after receiving an email. This makes email marketing one of the most effective sales channels. As of April 4, 2023, the United States was the country with the highest number of emails sent daily. Almost 10 billion emails were sent in the US. The United Kingdom, Belgium, the Netherlands, Japan, India, and Germany each had 8.3 billion emails sent per day. According to a 2022 survey, 25% of consumers in the US stated they were likely to purchase a product after receiving an email newsletter. However, email marketing acceptance varies according to age. 10% of US Millennials and another 36% of US Gen Zs were very unlikely to make purchases after receiving an email. Additionally, 79% of Millennials stated they liked being contacted by brands via email. The same was true for 57% of Gen Zs. GetResponse found that North America had the following email marketing KPIs in 2022: Compared to the US, Canada had higher open rates, click-through rates, and click-to-open rates in 2022. However, unsubscribe rates were lower in the US. In the United Kingdom, Belgium, the Netherlands, and Germany, 8.3 billion emails were sent per day as of April 2023. In the EU, the Netherlands had the highest open rates at 45.68% followed by France at 40.27% and Belgium at 34.66%. Belgium had the highest click-through rates at 4.5% while Ukraine had the lowest unsubscribe rates at 0.12% Data from Validity shows that average inbox placement rates for UK senders were 87%. That’s 4% above the global average and reflects the effects of the GDPR on open rates over the past three years. Additionally, based on an average revenue per email of 10p, poor inbox placement costs UK senders £13,000 per million emails sent. 2023 Research by GetResponse found that Europe had the following email marketing KPIs in 2022: For maximum engagement, the two best time slots to send an email according to GetResponse are: To improve opens and clicks, emails should be sent right before recipients wake up or just as they’re about to finish work for the day. During these times, inboxes tend to be less cluttered, and marketers have a higher chance of capturing audiences’ attention. When it comes to the best day and time to send an email, a 2023 Moosend study found that Thursday is the best weekday in terms of the highest open rate. Additionally, between 8 and 9 am is the best time of the day to send them. 2023 research by Omnisend also stated that the best time to send an email was 8 pm, 2 pm, or 5 pm. 2022 Research by Campaign Monitor echoes the data above. Based on global averages, these are the worst-performing days for sending emails: According to Brevo, the two best times to send an email across industries, are 10 AM and 3:30 PM as of July 2023. For its 2023 State of Email Marketing report, Mailmodo surveyed over 150 marketers and discovered that 35.3% of respondents said Tuesday is the best day to send emails. Fewer than 10% find weekends to be the best days to send emails. Emails get the most attention (19.66%) within the first hour of arriving in a recipient’s inbox. Up to 50% of all opens happen within the first eight hours. Timing is even more important when it comes to clicks — 32% of all clicks occur within the first hour of the delivery, and more than 50% of all interactions happen within the first four hours of delivery. According to Datanyze, the global email marketing industry consists of 471,773 companies and 233 of these companies produce email marketing technologies. Mailchimp holds 66.19% of the email total email market. This is followed by: As of 2023, an average of 347.3 billion emails are sent and received per day. This represents a 4.3% increase from 2022 and is set to exceed 361.6 billion in 2024. 39.4% of marketers sent 1-4 emails per month, on average, to subscribers in 2022. 36% sent between 4 to 8 emails while over 24% sent over 8 emails per month. At 83%, newsletters were the most common email marketing campaign sent in 2022. The second and third most common types of campaigns sent were promotional (72%) and welcome emails (71%). Litmus analyzed over 19 billion email opens in 2022 to determine where subscribers read their emails. The breakdown of market share for email clients on mobile and desktop put Apple Mail in the lead at 59.8%. In second place was Gmail with 27.6% of all opens, followed by Outlook with a share of 4%. According to Mailmodo, 31.3% of marketers sent interactive emails in 2022. That’s an improvement of 7.3% from 24% of marketers in 2021. Of these marketers, 34.29% used a no-code tool/editor to create interactive or AMP emails. The common widget included was forms, which was used in 581 million emails. According to Fortune Business Insights, key developments in the email marketing industry between 2020 and 2022 include: According to Litmus, marketers in 2022 used automation for the following: Checking against spam filters was another common automated process. The top tools email marketers are using for this are: In addition to fully automated sequences, individual emails were also automated. The most common were: The most popular project management tools email teams used to automate tasks were: Statista estimates that the email marketing market could grow at a CAGR of 13.3% and exceed $17.9 billion by 2027. As of 2023, email marketing revenue is estimated at over $10 billion. This is up $2.5 billion from 2020 when the global email marketing market was valued at $7.5 billion. The number of email users will grow to 4.6 billion in 2025. In 2020, there were four billion global email users. It is estimated that 376 billion emails will be sent and received daily in 2025. According to Statista, approximately 306 billion emails were sent and received every day worldwide in 2020 alone. As of 2023, 95% of users do not click on website redirect links placed inside emails. Netcore states that static emails with CTA links have become obsolete. Today, users prefer the ease of interactive AMP emails. AMP components allow brands to create an app-like framework and get users to accomplish tasks within emails. Research by Validity shows that AMP-enabled emails are approximately 20% more likely to convert. Other ways to increase email marketing effectiveness in 2023 and beyond include: Email marketing continues to assert its value as an indispensable tool for businesses aiming to connect with their audiences effectively. With an impressive ROI and increasing global user base, email strategies are not just surviving but thriving in the digital age. The ability to personalize content and measure the impact of campaigns ensures that email marketing remains relevant, dynamic, and highly effective in achieving diverse marketing goals.Email Marketing Statistics Highlights
Key Takeaways: Email Marketing in 2024
Email Marketing ROI Statistics
Email Marketing Effectiveness Statistics
Email type Open Rate Click-Through Rate click-to-Open Rate Unsubscribe Rate Spam Rate Bounce Rate Triggered 35.33% 3.69% 10.44% 0.28% 0.01% 4.97% Autoresponder 35.91% 4.26% 11.85% 0.21% 0.01% 2.03% Newsletter 26.7% 2.13% 7.98% 0.09% 0% 3.27% RSS 44.54% 7.24% 16.24% 0.05% 0% 0.8% Number of Emails Open Rate Click-Through Rate click-to-Open Rate Unsubscribe Rate 1 94% 31.43% 33.43% 0.67% 2 67.59% 18.17% 26.88% 0.53% 3 54.69% 15.27% 27.92% 0.58% 4 70.03% 14.66% 20.93% 0.48% 5 52.88% 9.08% 17.17% 0.67% 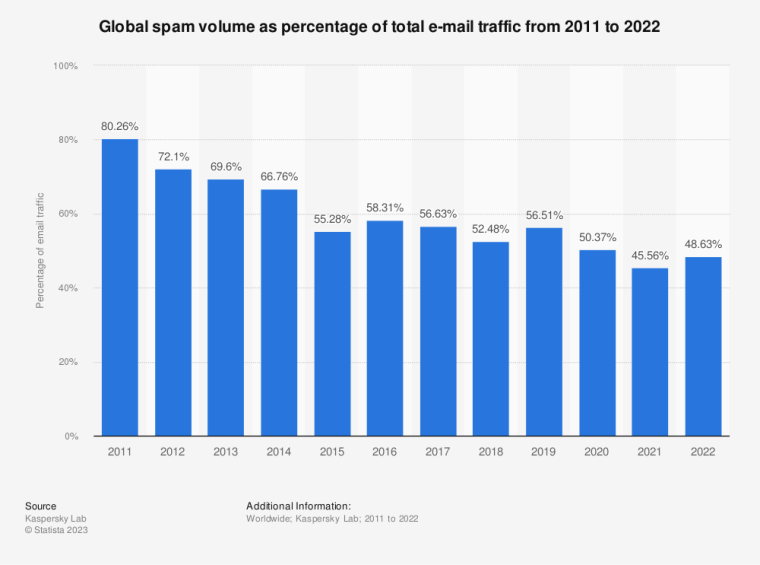
Subject Line Characters Delivered Rates Open Rates 0 – 20 76.94 14.61 21 – 40 73.65 16.87 41 – 60 82.20 15.66 61 – 80 79.80 14.70 81 – 100 73.38 14.00 Email Marketing Statistics by Industry
Industry Open Rate Click-Through Rate Click-to-Open Rate Unsubscribe Rate Advertising and marketing 20.5% 1.8% 9.0% 0.2% Agriculture, forestry, fishing, hunting 27.3% 3.4% 12.5% 0.3% Consumer packaged goods 20% 1.9% 11.1% 0.1% Education 28.5% 4.4% 15.7% 0.2% Financial services 27.1% 2.4% 10.1% 0.2% Restaurant, food, and beverage 18.5% 2.0% 10.5% 0.1% Government and politics 19.4% 2.8% 14.3% 0.1% Healthcare services 23.7% 3.0% 13.4% 0.3% IT/tech/software 22.7% 2.0% 9.8% 0.2% Logistics and wholesale 23.4% 2.0% 11.7% 0.3% B2B Email Marketing Data
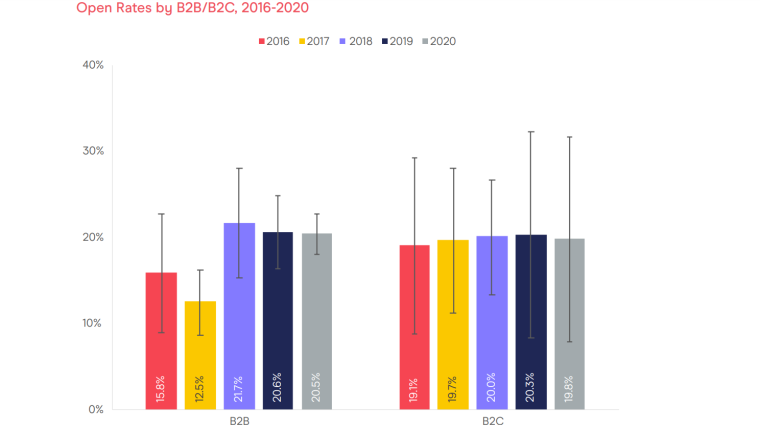
B2C Email Marketing Data
E-commerce Email Marketing Data
Non-profit Email Marketing Data
Email Marketing Statistics by Country
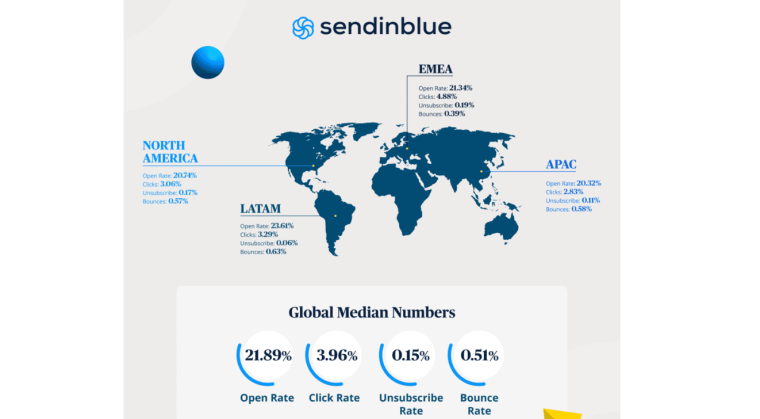
Region 2022 Open Rate 2022 Click-Through Rate 2022 Click-to-Open Rate 2022 Unsubscribe Rate America 21.0% 2.2% 10.4% 0.1% UK 22.9% 2.4% 10.6% 0.1% European Union 22.1% 2.2% 10.7% 0.2% Asia-Pacific 22.4% 3.0% 13.4% 0.3% Africa 19.14% 1.16% 6.08% 0.08% North America Email Marketing Stats
EU Email Marketing Stats
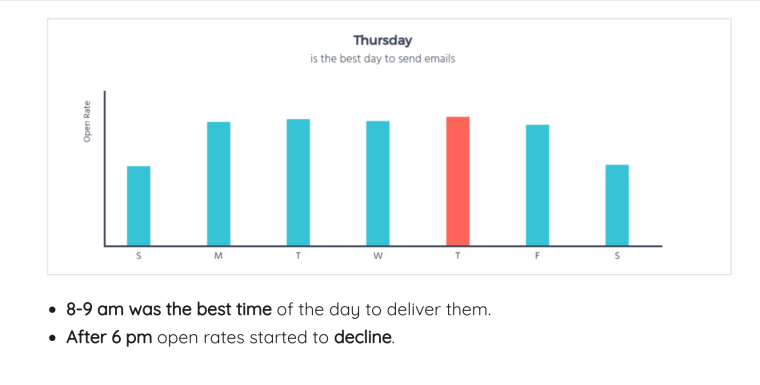
When is the Best Time to Send an Email?
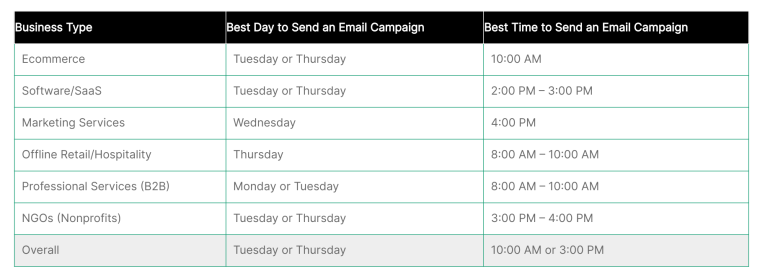
Industry Best Day to Send an Email Worst Day to Send an Email Banking/mutual funds/securities Wednesday Saturday E-commerce/e-grocery/e-fashion Monday Saturday Financial services Tuesday Sunday and Saturday Foodtech/delivery Tuesday Thursday Gaming Tuesday Thursday Loyalty Sunday Thursday Tools and accessories Saturday Thursday Travel/tourism Saturday Monday and Tuesday 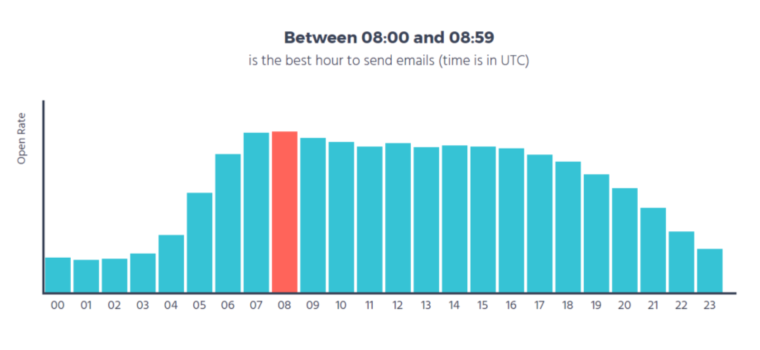
Hours % of All Email Opens Cumulative % % of All Email Clicks Cumulative % 0 19.66% 19.66% 31.95% 31.95% 1 7.99% 27.65% 7.76% 39.71% 2 5.48% 33.13% 5.41% 45.12% 3 4.43% 37.56% 4.31% 49.43% 4 3.69% 41.24% 3.46% 52.89% 5 3.16% 44.41% 2.81% 55.71% 6 2.78% 47.18% 2.36% 58.07% 7 2.49% 49.67% 2.05% 60.12% 8 2.24% 51.91% 1.78% 61.9% Email Marketing Tools Data
Email Marketing Automation Data
The Future of Email Marketing
Final Thoughts
FAQs
How effective are emails in marketing?
Why should a business use email marketing?
What are the four types of marketing email?
References
- Statista
- Statista
- Mailjet
- Mailjet
- Litmus
- Constant Contact
- Campaign Monitor
- Netcore Email Benchmark 2023
- GetResponse
- Litmus 2023 State of Email Workflows
- Content Marketing Institute
- Mailjet Inbox Insights 2022
- Campaign Monitor
- Statista
- Brevo
- Gartner
- Insider Intelligence
- Gartner
- Validity 2021 Email Benchmarking Report
- Dream Data
- Digital Commerce 360
- Gartner
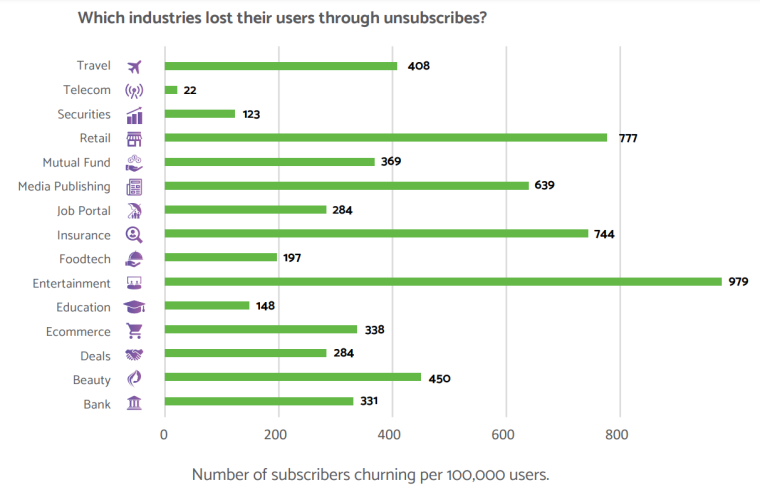
- Netcore Email Benchmark 2020
- Constant Contact
- Statista
- Statista
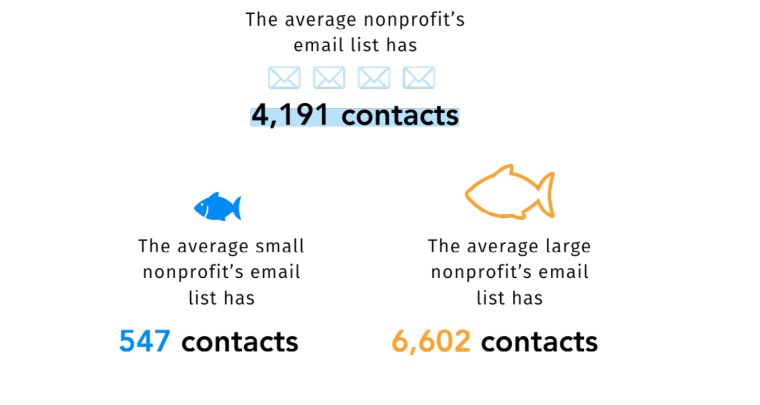
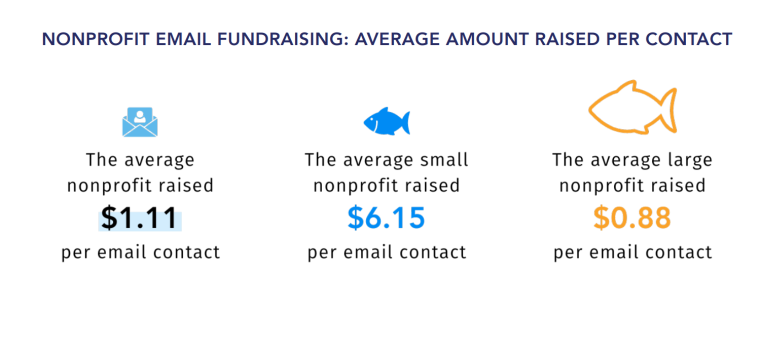
- Neon One
- Statista
- Cheetah Digital CTI 2023
- Moosend
- Omnisend
- Brevo
- Mailmodo State of Email 2023
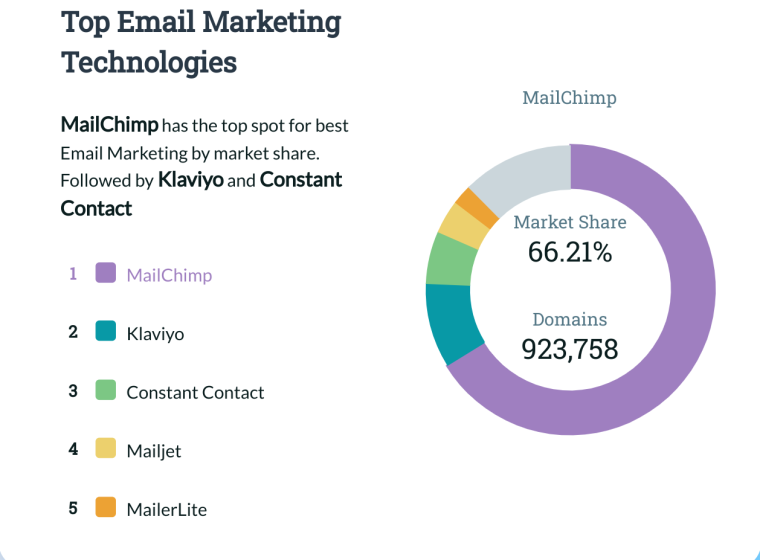
- Datanyze
- Oberlo
- Litmus
- Fortune Business Insights
- Statista
- Statista
- Validity