Do you want to know how to increase your people talking about this (PTAT) on Facebook by 20%? Or do you want to know what content resonates best with your audience? Either way, you’ll need to use the cycle MAA analysis (metric, analysis, action) and then optimize the result:
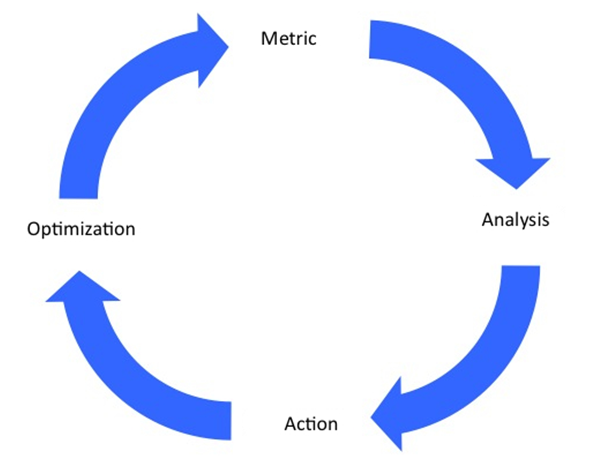
MAA analysis provides the ability to quantify goals and the direction to accomplish them.
So, how do you perform MAA analysis? If you’re willing to put in some effort and think hard, it’s not too difficult. Before you start though, you need to ask yourself an important question
Why do you have a Facebook page?
Different brands serve various purposes. For instance, some pages, such as the fictional character Tamaki Suoh, are meant for entertainment. Other pages, like March of Dimes, aim to promote a cause. However, you are likely looking to sell a product or service. There are several ways to utilize Facebook to enhance these business models, including:
- Raise awareness about a brand/product
- Showcase your industry knowledge
- Create a community around your brand
Different purposes merit different actions. If your product sells itself (or doesn’t lend itself well to social), you might showcase your industry knowledge instead. Think about your purpose before you start posting content. Without a goal in mind, any post is just as good as any other.
Now that you have your purpose, you can use MAA analysis to determine how to achieve that goal.
Step 1: Metrics – What are the numbers?
Each number is measuring a goal. Facebook gives you several metrics such as “people talking about this” (PTAT) and reach, and you can even create your own, such as engagement rate.
By choosing your goal, you take the first step in MAA analysis.
Here are a few examples of Facebook metrics you can use to benefit your business.
- People discussing this: This is a useful measure of engagement. If your aim is to build a community around your brand, pay attention to this metric. It shows the number of unique individuals who have shared a story about your brand, whether they commented, liked, or shared one of your posts.

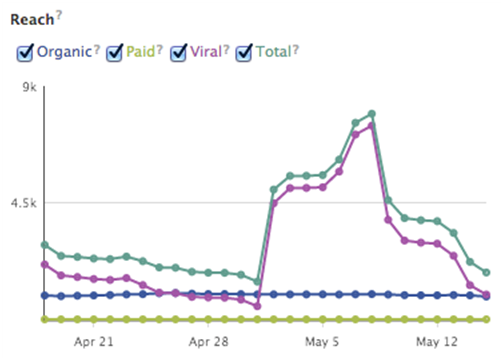
- Reach: This metric gives you an idea of your audience size. If your goal is to create awareness about your brand, this is an especially important metric to look at. It tells you the number of unique people who have seen any content associated with your page
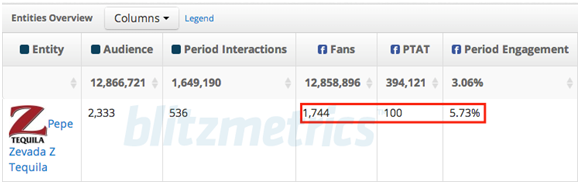
- Engagement rate: Does your competitor have 4 or 5 times the PTAT you do? Don’t get down just yet! Larger pages will have more people talking about them. It’s just the way of life. Using engagement rate as a metric lets you compare your page (or a client’s page) to your page regardless of the number of fans each of you have. Engagement rate is a great way to benchmark yourself against a competitor when your competitor has a vastly higher or lower number of fans than you. It is PTAT divided by your total fans.
Step 2: Analysis – What do these numbers mean?
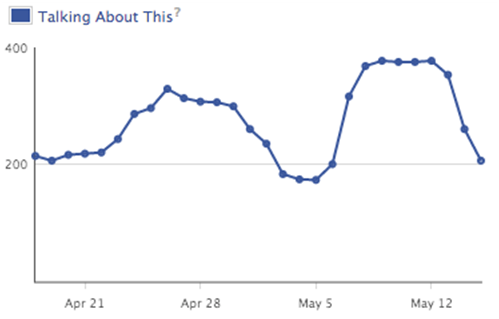
The key to analysis is linking the change in your metrics to the content you posted. Now let’s take a look at the insights for NetWeave Social Networking, a small business that provides social media content management for other companies.
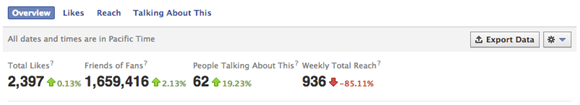
That PTAT number isn’t looking too bad. What could have caused the increase?
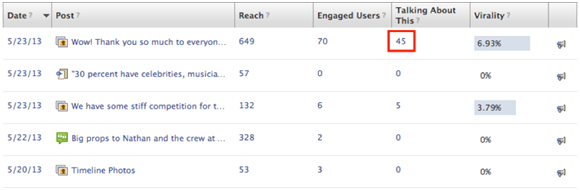
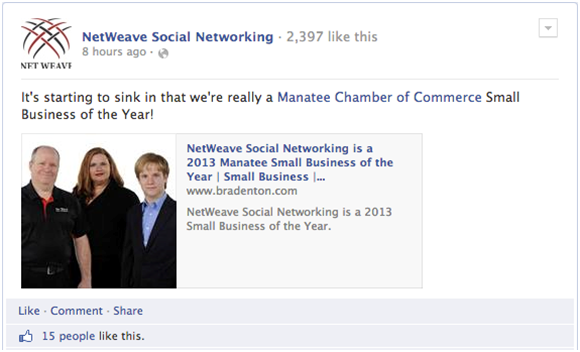
Looks like we found the source! Now, let’s examine this individual post to learn more:
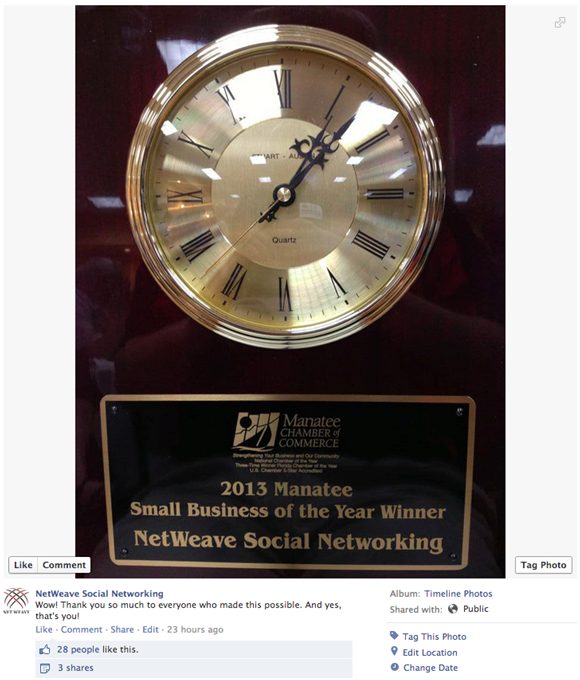
You have the number and you have the post. The analysis you make links the two together to provide a basis for action. As an owner of NetWeave Social Networking, I need to understand why this post was so successful.
Purpose: Create a community around NetWeave Social Networking
Metric: PTAT increased by 20% this week to 63
Analysis: The reason for the spike in PTAT this week was due to an enormously popular post on May 23nd. Characteristics of this post include directly addressing the user and show casing a business accomplishment. Therefore, another post that ties NetWeave fans into NetWeave success would likely perform well.
Remember, only humans can perform analysis. A computer can make graphs and show you numbers, but you are the one that determines what they mean.
Step 3: Action – What should you do about it?
Great, by knowing what PTAT is and linking the rise in PTAT with a specific post (or posts, depending on your case), we’ve learned something about NetWeave’s fans. Now, I need to figure out what to do about it. Because there are so many ways to integrate social with your existing media strategy, your knowledge is the only limiting factor in determining the action(s) you want to take. Here is my complete MAA of this figure.
Purpose: Create a community around NetWeave Social Networking
Metric: PTAT increased by 20% this week to 63
Analysis: The reason for the spike in PTAT this week was due to an enormously popular post on May 23nd. Characteristics of this post include directly addressing the user and show casing a business accomplishment. Therefore, another post that ties NetWeave fans into NetWeave success would likely perform well.
Action: NetWeave should post more of this kind of content. This will create more engagement, increase EdgeRank, and therefore recapture fans that haven’t interacted with the page in a long time. If it wanted to, NetWeave could even use partner targeting to include those most likely to use NetWeave’s services. By using these posts as a stepping-stone for engagement, NetWeave can create more content that involves fans with the brand and therefore build its community.
Step 4: Optimization
Now that NetWeave has this action, let’s look at what happens when it makes a similar kind of post.
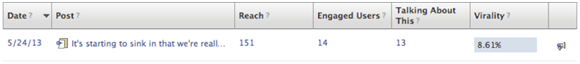
Not bad! Links don’t perform as well as photos, but are still good for variety. As a matter of fact, a higher percentage of people created a story from this post as opposed to the previous post (measured by the virality metric). Still, it would definitely be better to use a photo next time, or even just a plain text update.
Optimization is an important step in MAA analysis because it lets you measure the result of your actions and modify them accordingly.
Lake Tahoe Resort
MAA analysis is cyclical, meaning that the optimization of one analysis will lead you to measure the metric again and start over. Let’s do an analysis of Lake Tahoe resort starting with the optimization step of the previous analysis: noting the success of posts on other pages
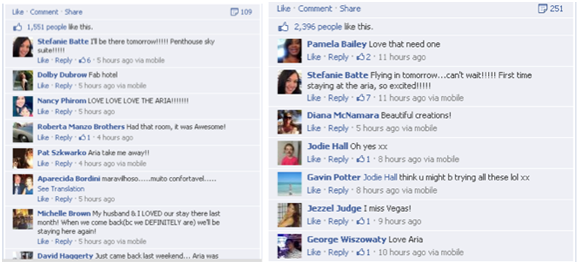
Optimization: Every Aria Resort & Casino posts a picture 2-3 times per day. User comments express envy of being able to stay at the resort, or users will share stories of the good times they had while visiting.
Now that we can see the power of visual content, which kinds of posts perform the best
Metric: According to a month long study, Food and restaurant posts perform the best.
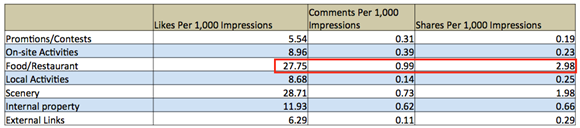
Analysis: People in general respond well to photographs, but they have to be desirable. This is why beautiful or delicious looking photos have performed well, while photos of hotel interiors don’t.
Action: To increase engagement, Lake Tahoe should post more desirable photographs, including food/restaurant and scenery photos. Furthermore, Lake Tahoe should post more frequently, increasing its posts from 1 post per day to 2 or 3 per day as seen on the successful Aria Resort & Casino page.
The Takeaway
There are several ways to measure Facebook success
- Create a community: Look at PTAT
- Create awareness: Reach
- Compare your community to a competitor’s: Calculate engagement rate.
By analyzing these metrics with a purpose in mind, you can create a comprehensive analysis to show any brand:
- Who its fans are
- What its fans like
- How its actions affect its fans
- How the brand can modify its actions to achieve its purpose more effectively
Provide quantifiable data that leads to actions, and you can quantify the value of Facebook marketing. The true benefit of MAA analysis is that it is a way to continually improve your content.
Readers, why do you have a Facebook page? What metrics do you look at?
Sean McNulty contributed research to this post.